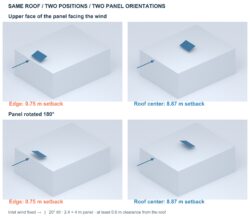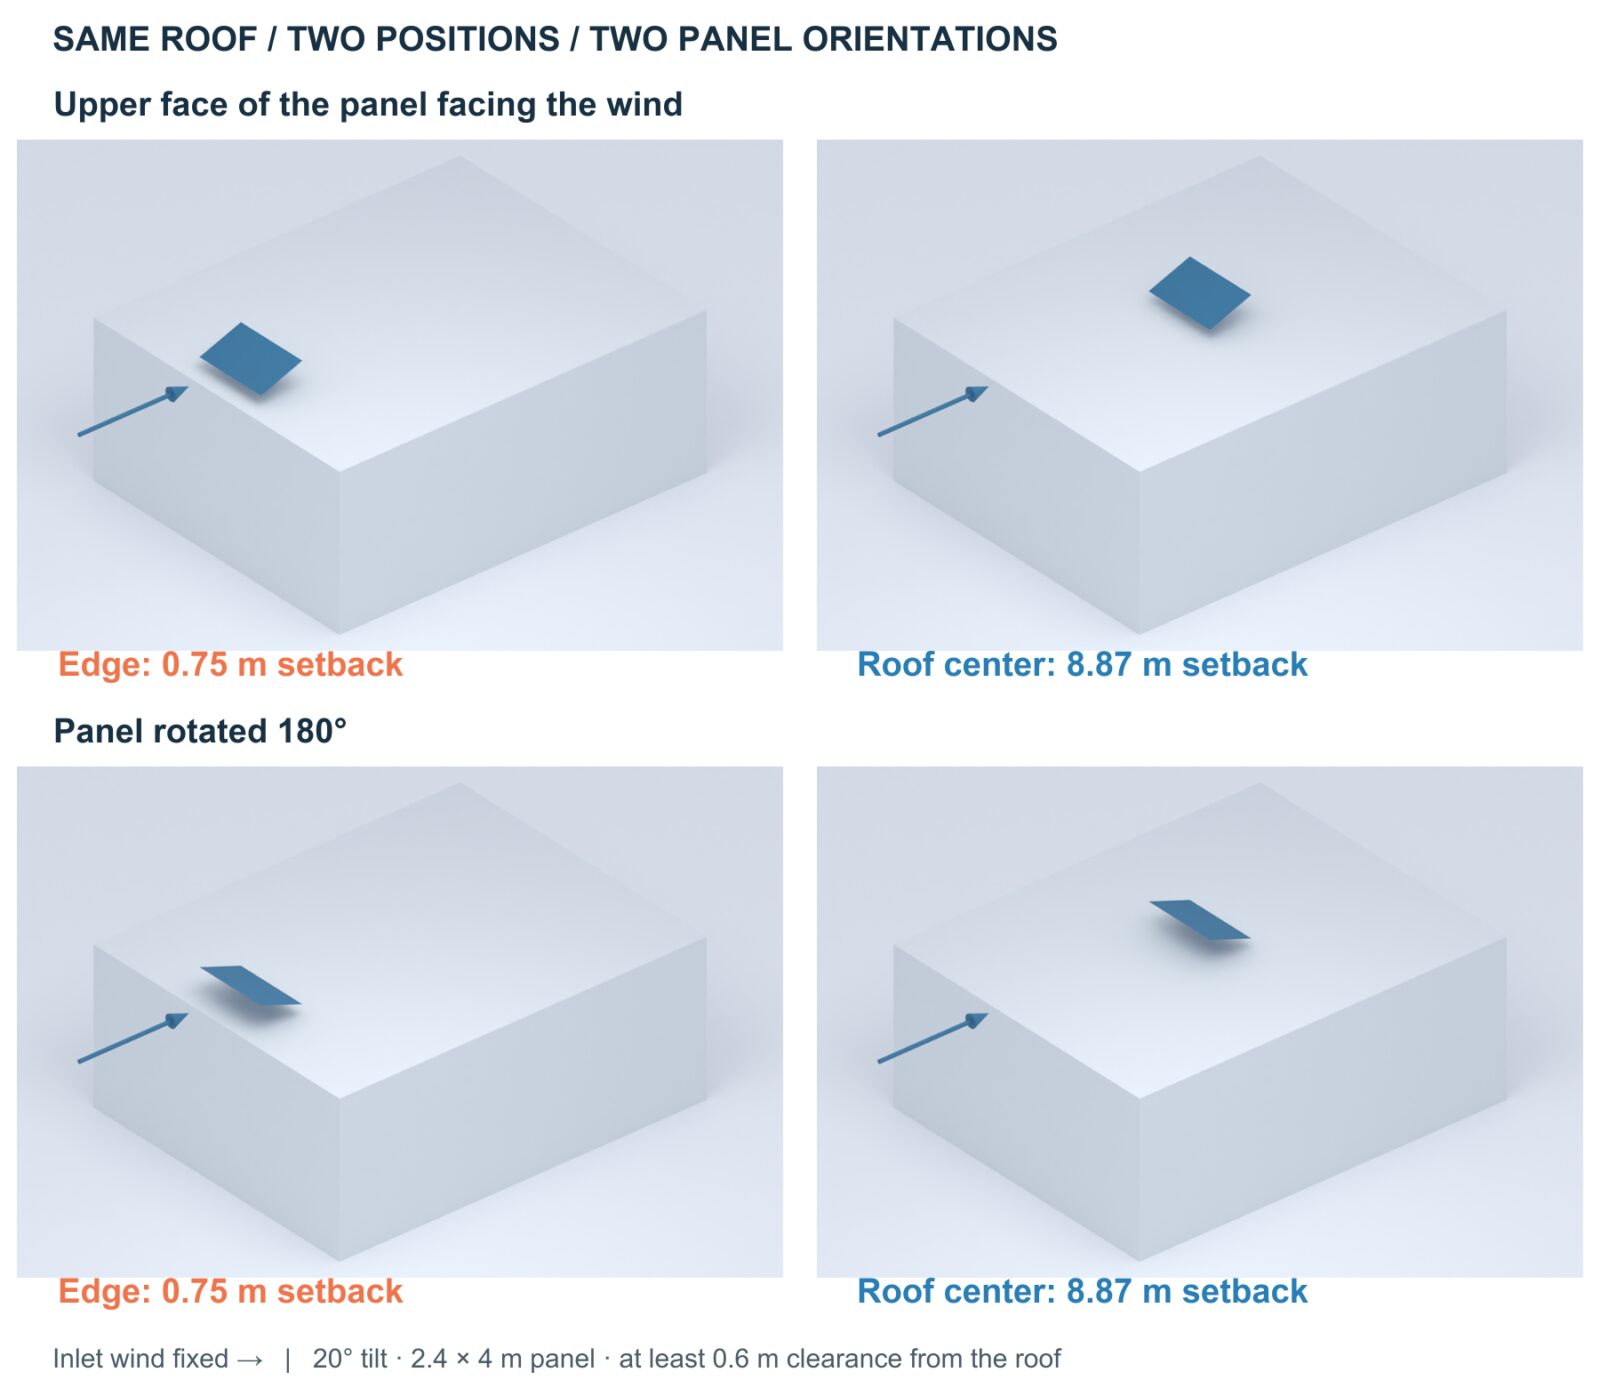
The wind effect on a rooftop solar panel does not depend only on the panel’s tilt. The airflow that changes at the roof edge can cause the same panel to experience different pressures at different positions. In this study, we compared the same panel at two roof positions and in two orientations.
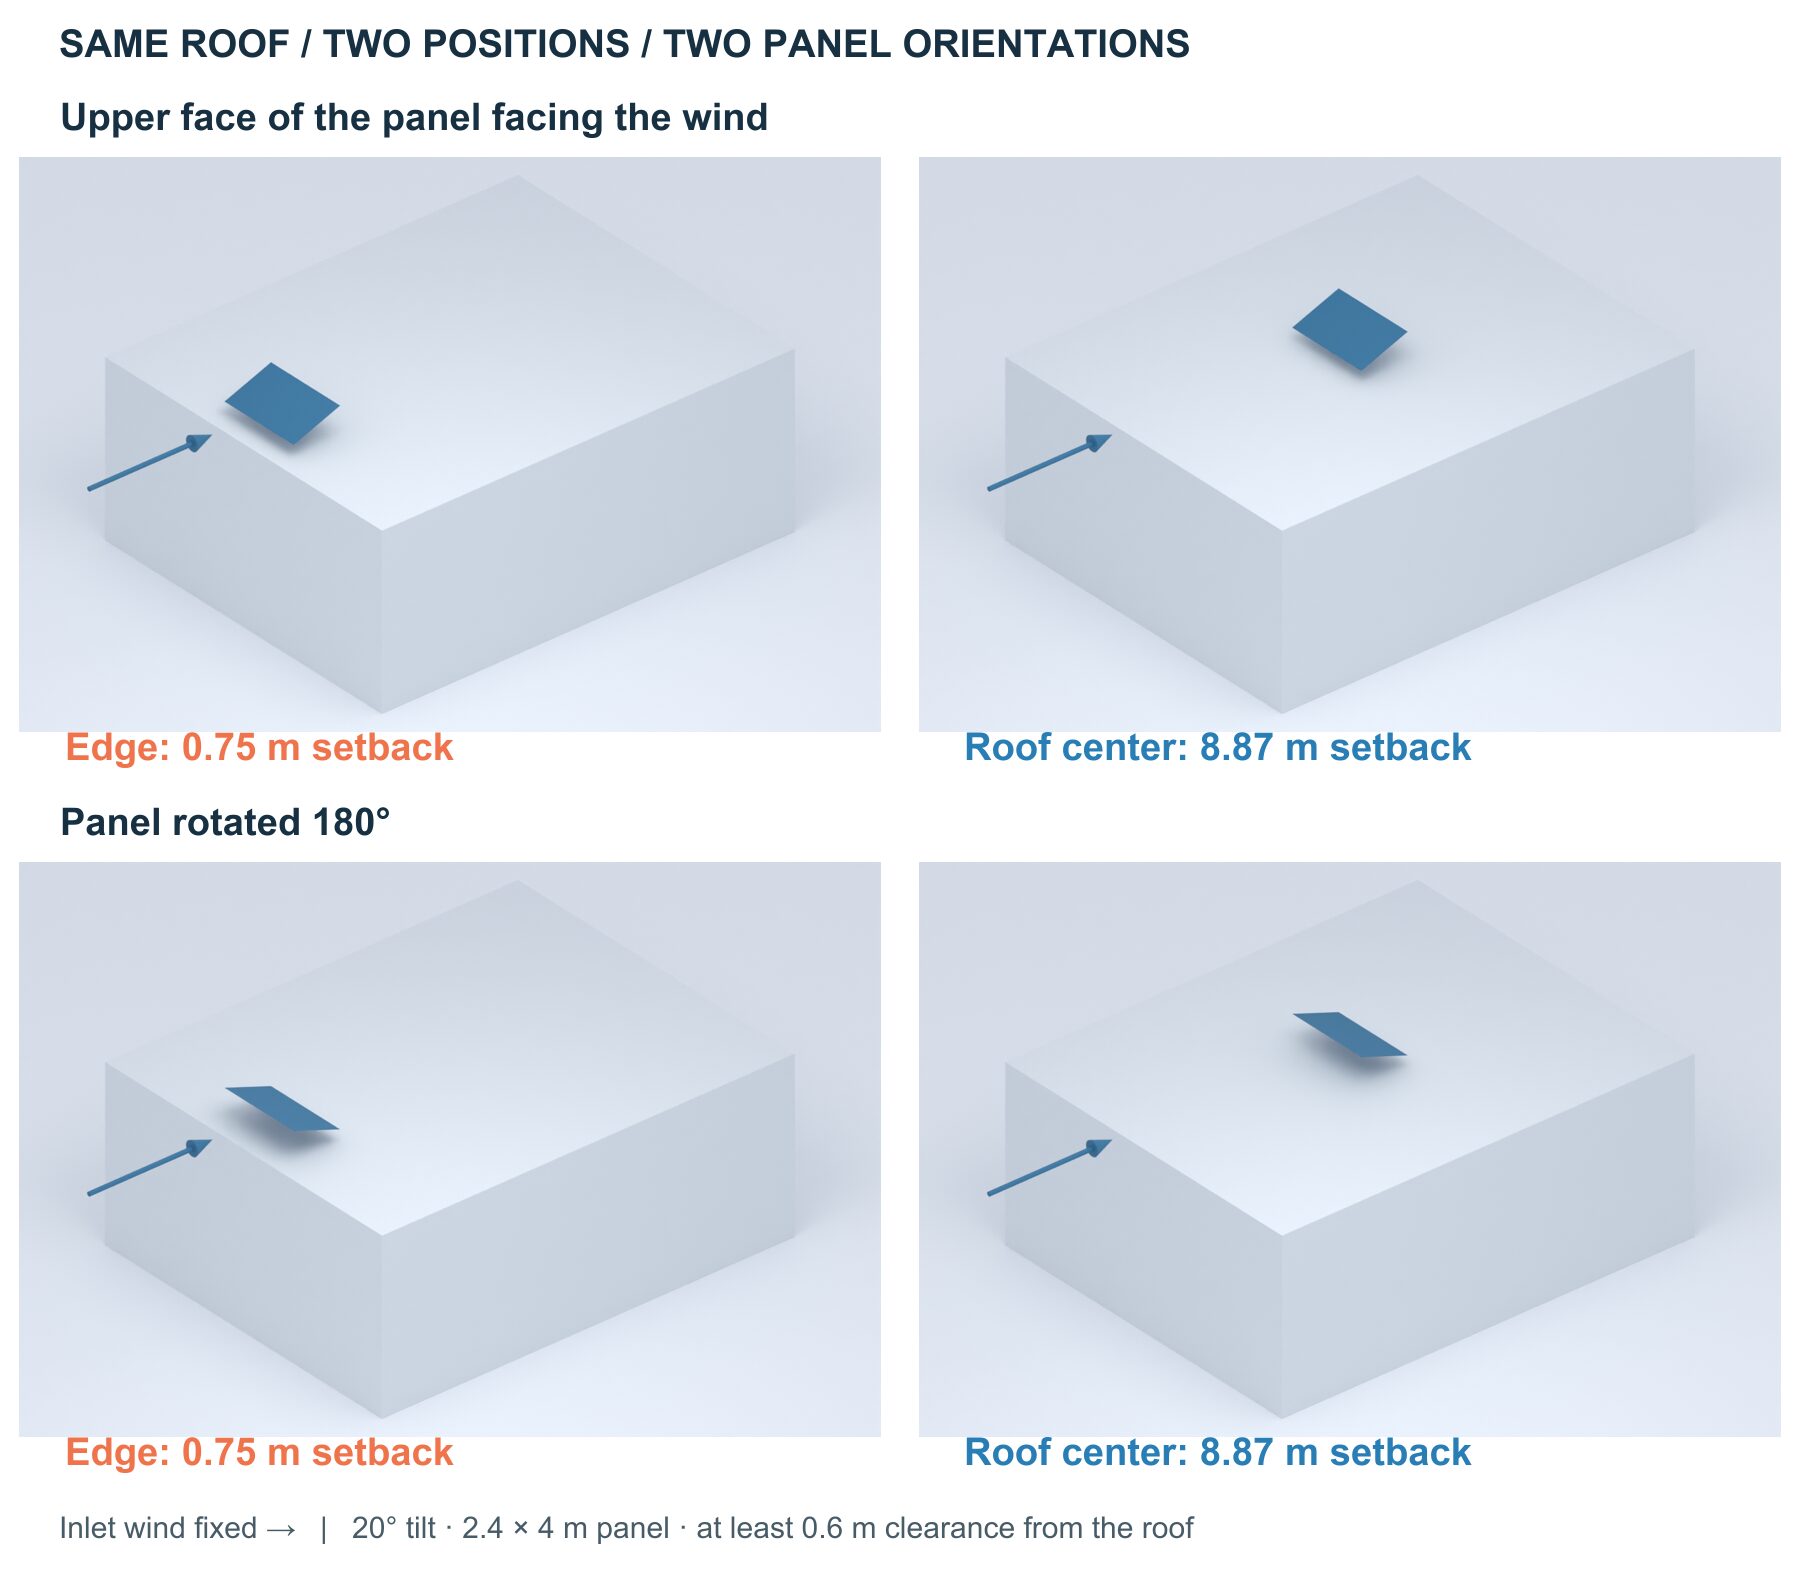
In the comparison, we used a flat-roofed building of 20 × 16 × 8 m and a 2.4 × 4 m panel tilted at 20°. The minimum clearance between the panel and the roof is 0.6 m. The positions are 0.75 m in from the windward edge and at the roof center; in all four cases the wind is 10 m/s and from the same direction.
In the facing the wind case, the upper face of the panel points toward the oncoming wind. In the rotated 180° case, we turned the panel about its vertical axis; its position on the roof and its tilt angle stayed the same.
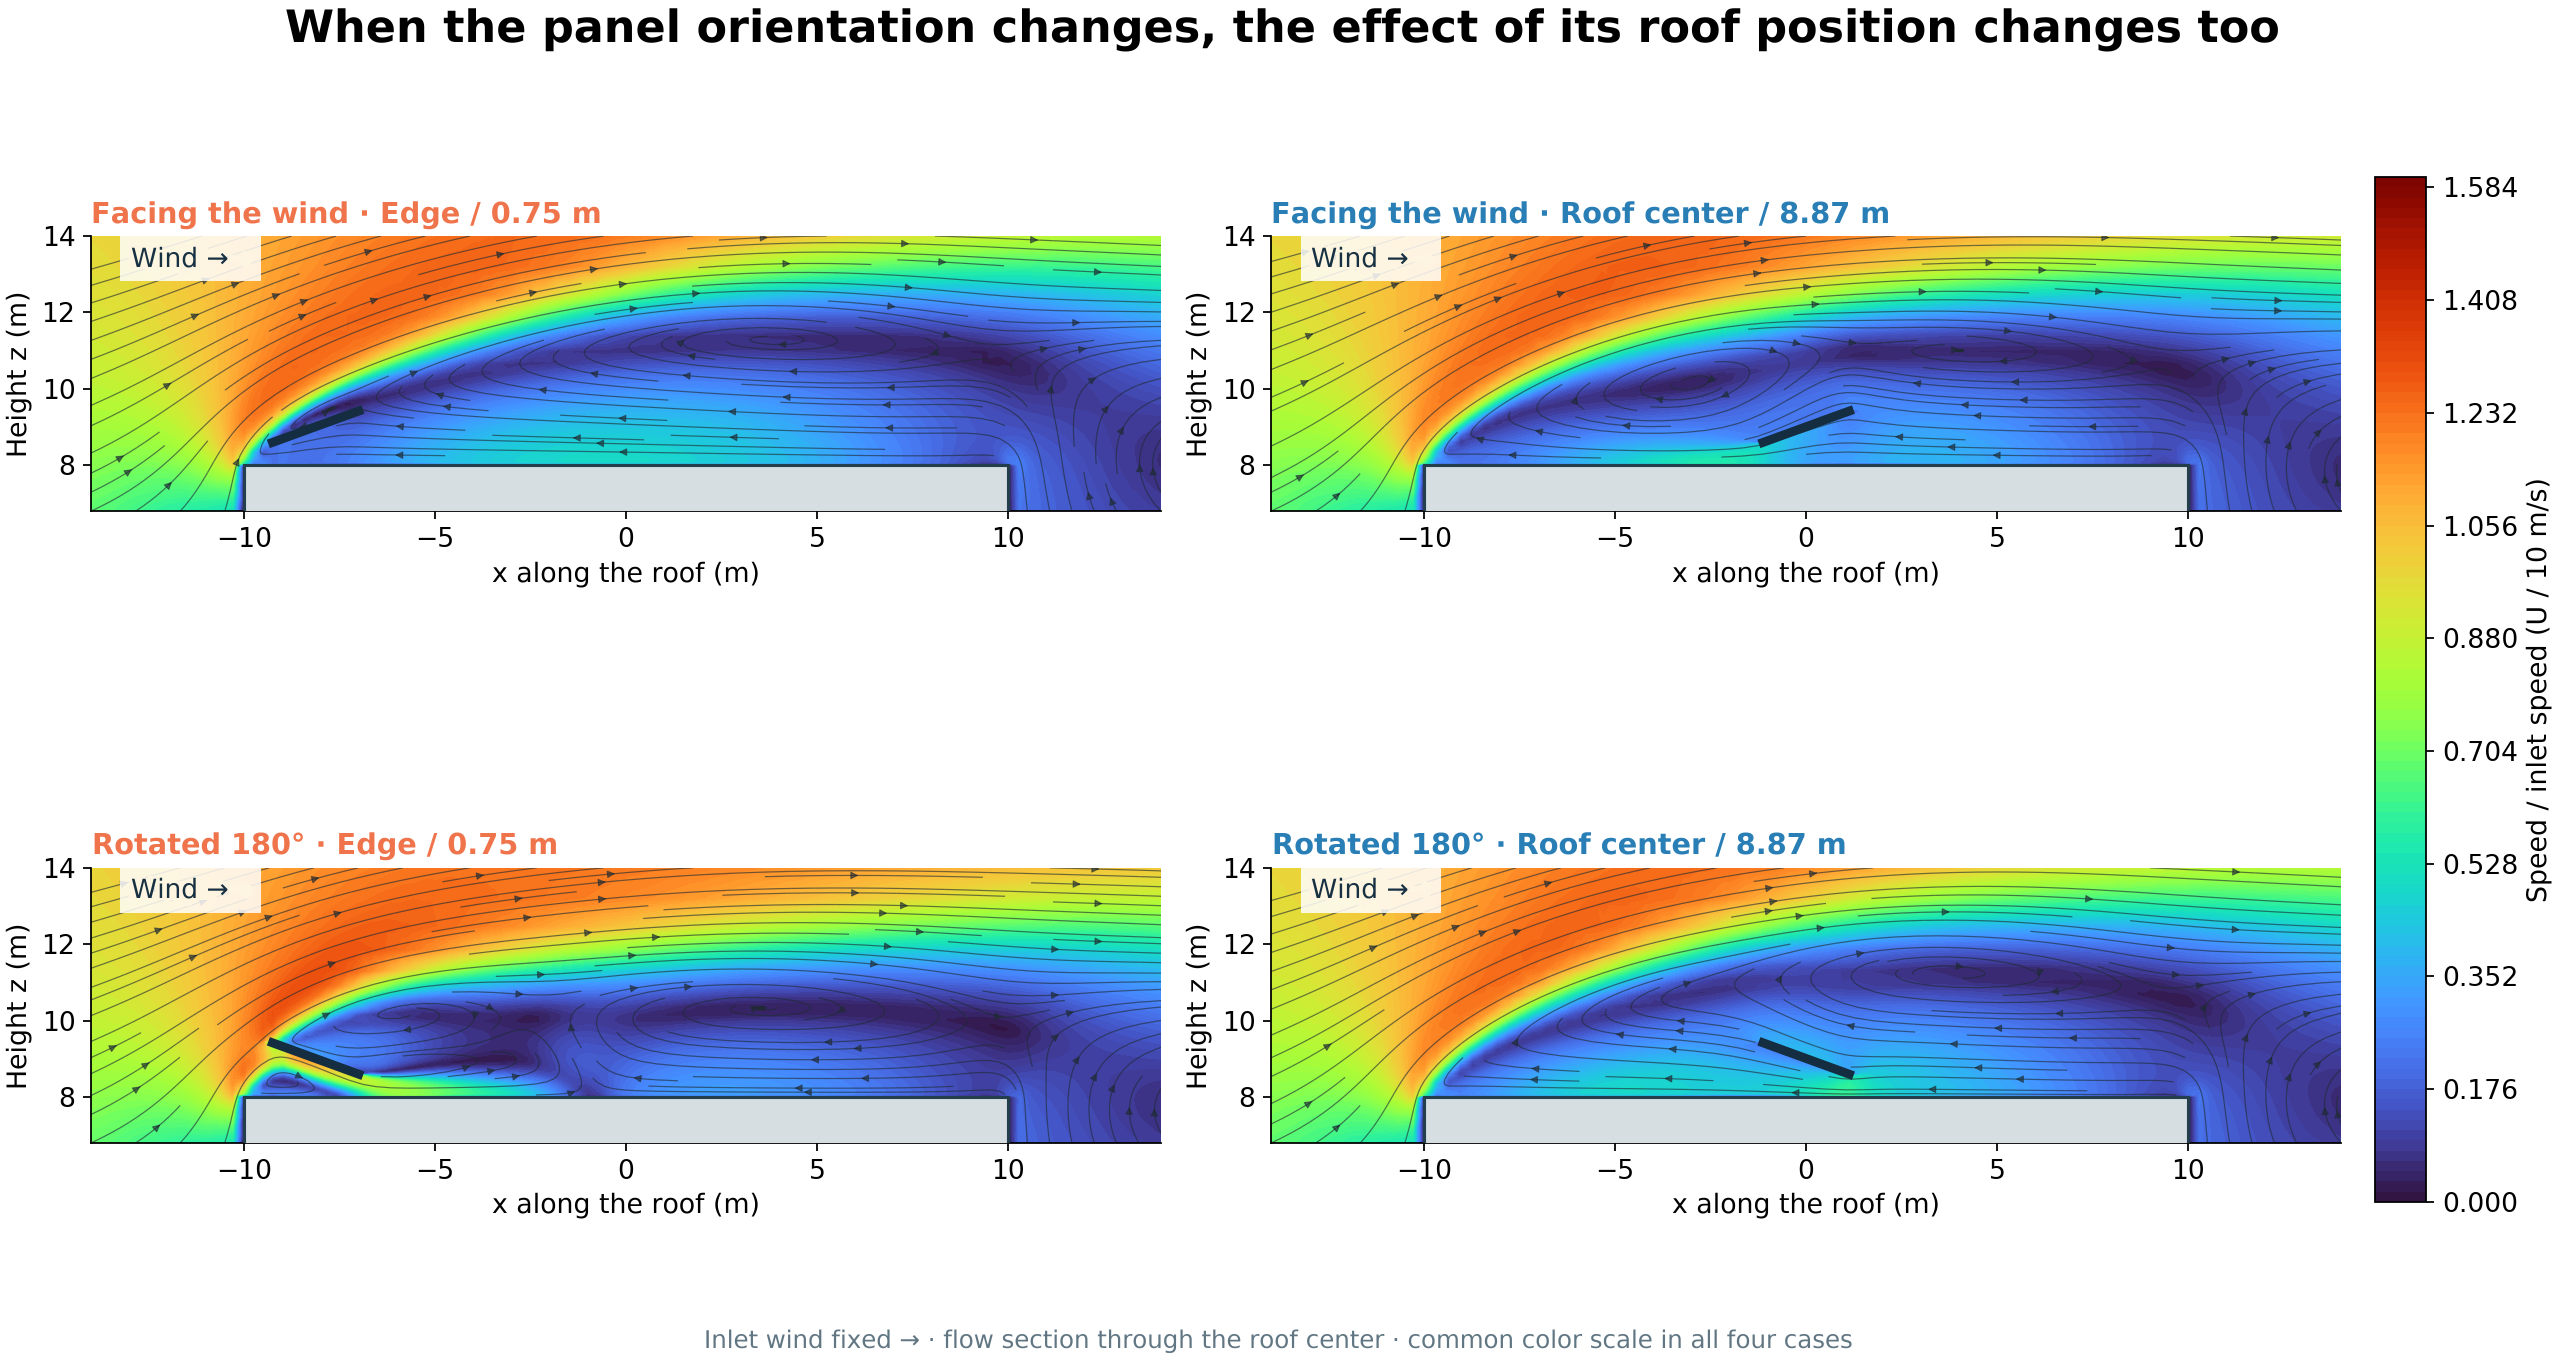
The air separates from the surface at the roof edge and turns upward; part of it can flow back over the roof. As a result, the flow passing over and under the panel changes with its position on the roof. The colors show the ratio of the local speed to the 10 m/s wind, and the lines show the paths the flow follows. The same color scale is used in all four views.
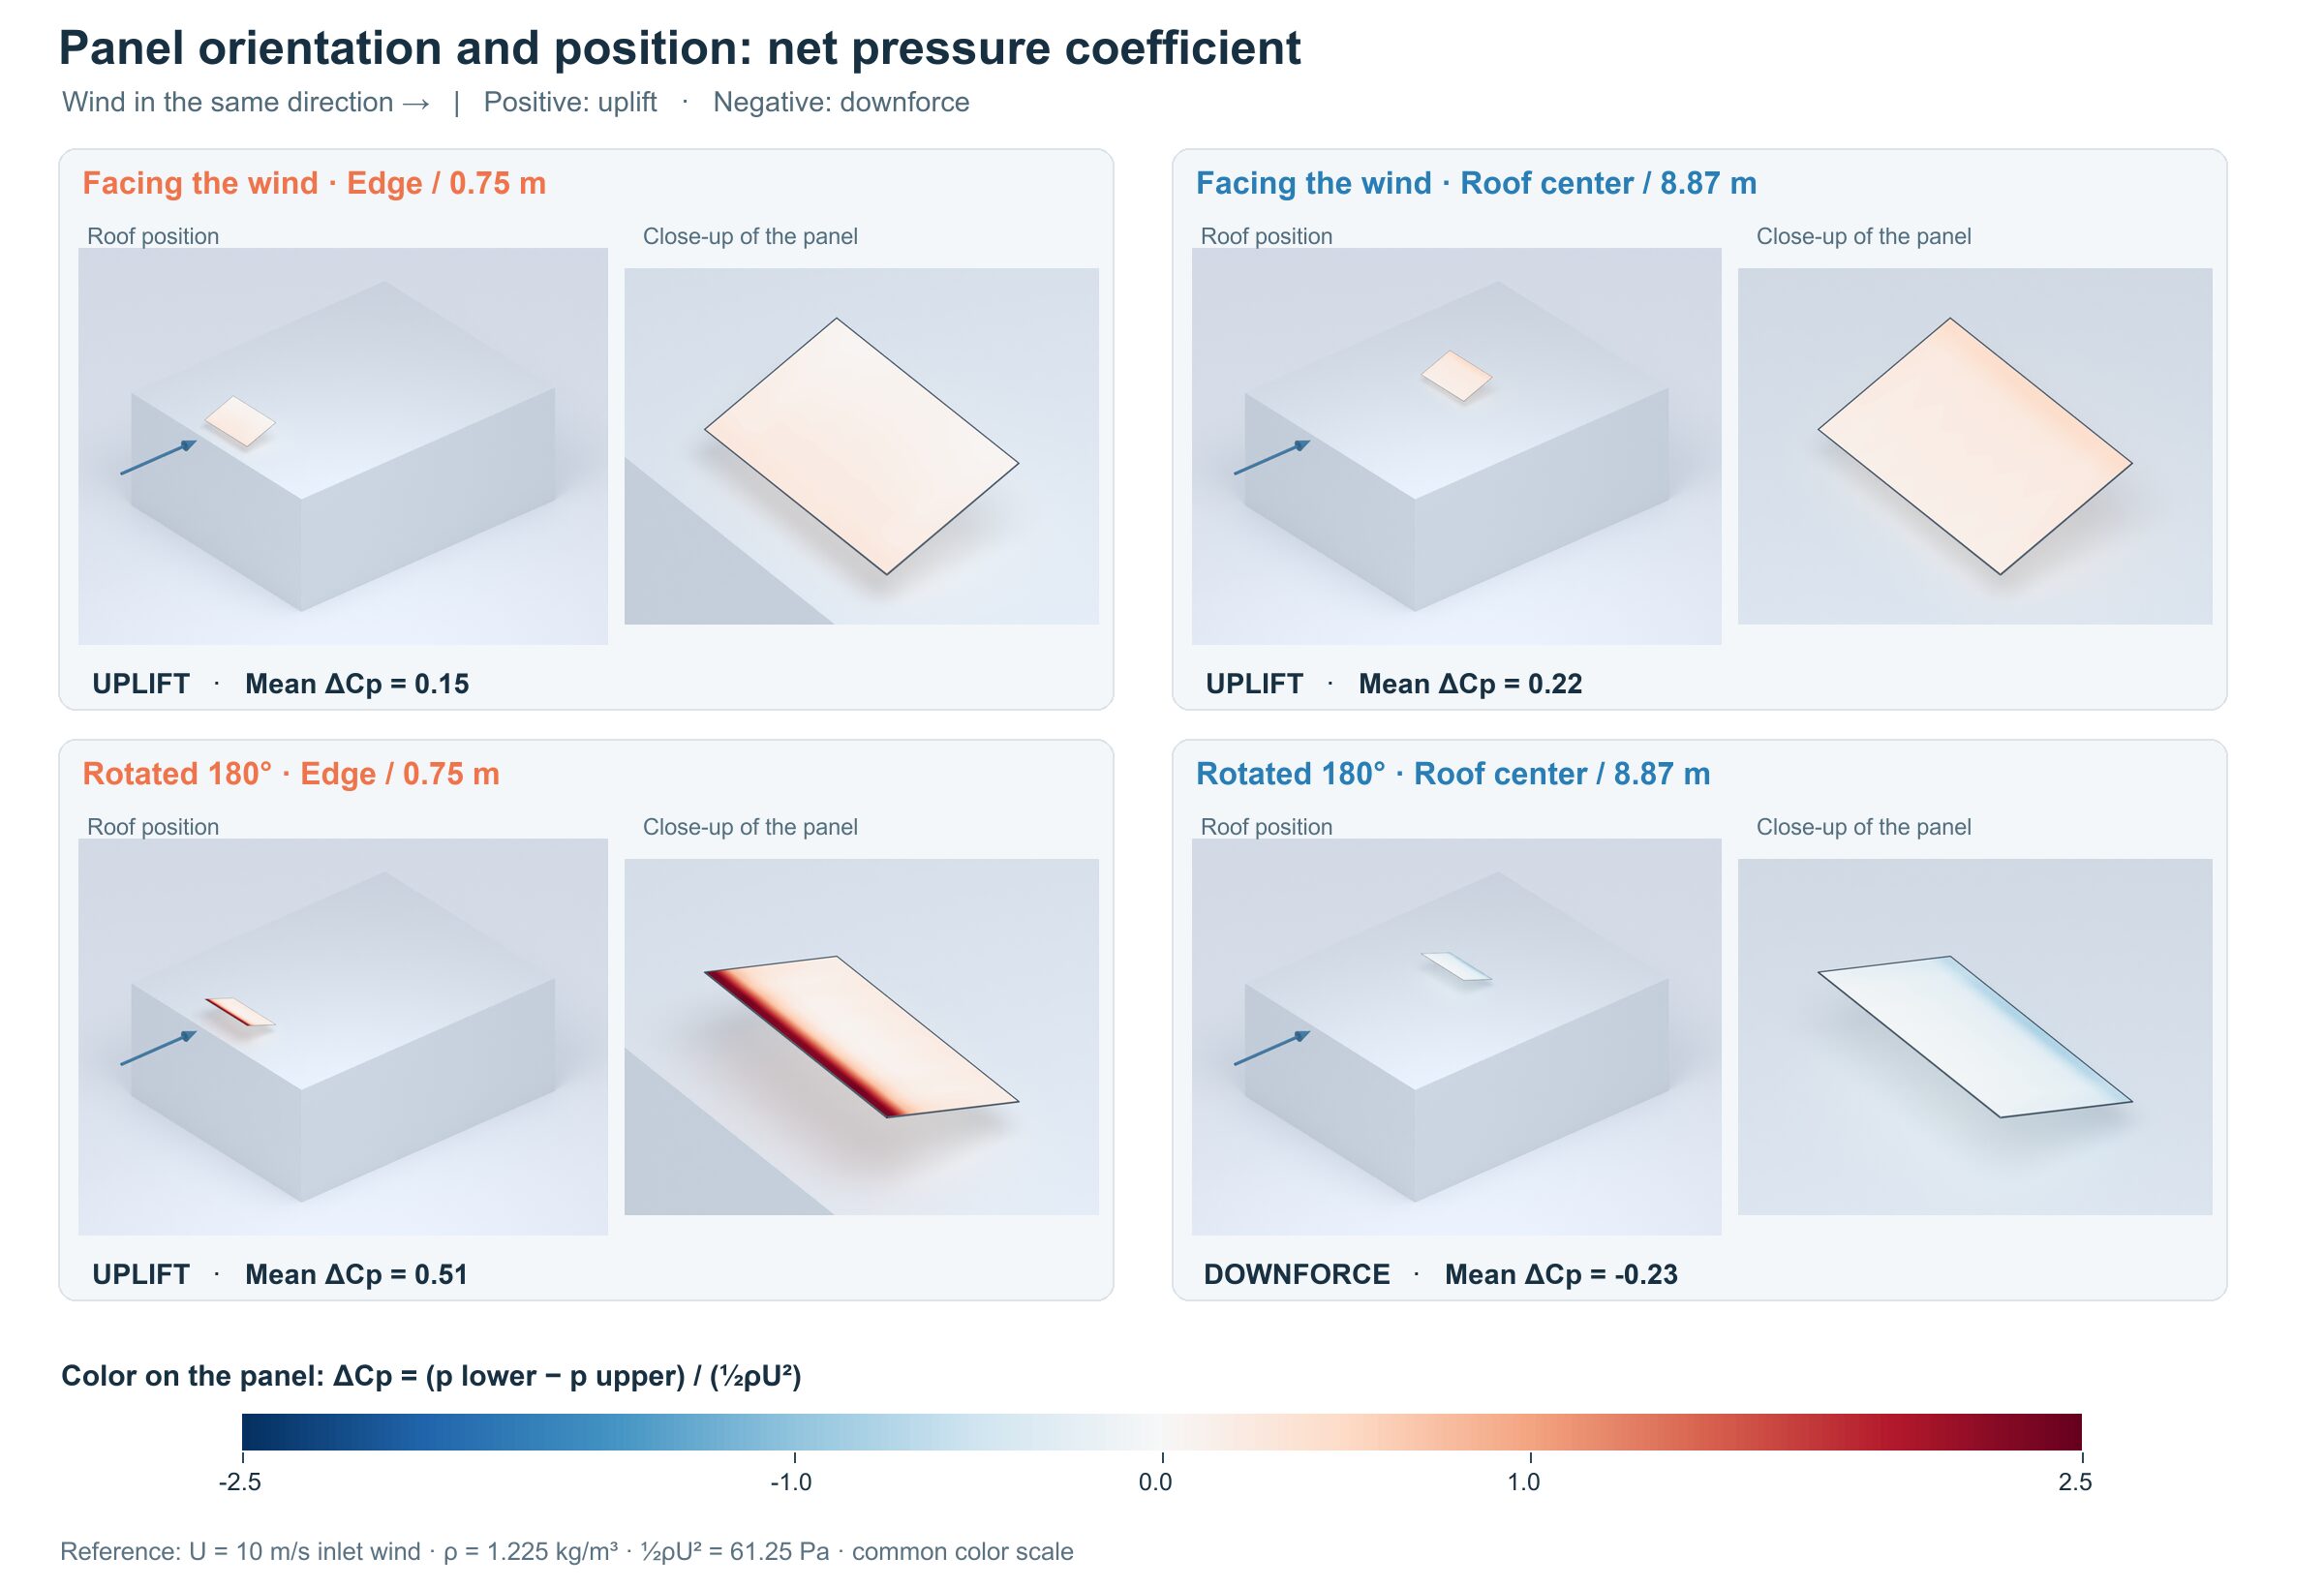
Whether the panel is lifted or pressed down depends on the pressure difference between the lower and upper faces. If the lower-face pressure is higher, the net effect is uplift; if the upper-face pressure is higher, it is downforce. In the maps, red tones show uplift and blue tones show downforce.
We calculated the net pressure coefficient as ΔCp = (p lower − p upper) / (½ρU²). Here U = 10 m/s is the inlet wind and the air density is ρ = 1.225 kg/m³; the denominator is therefore 61.25 Pa, the dynamic pressure of the inlet wind. This lets us compare the four layouts with a dimensionless coefficient referenced to the same inlet wind. The coefficients in the table are averages taken over the panel area.
| Panel orientation | Roof position | Mean ΔCp | Approximate mean net pressure |
|---|---|---|---|
| Facing the wind | Edge / 0.75 m | +0.15 | +9.2 Pa |
| Facing the wind | Roof center / 8.87 m | +0.22 | +13.7 Pa |
| Rotated 180° | Edge / 0.75 m | +0.51 | +31.1 Pa |
| Rotated 180° | Roof center / 8.87 m | -0.23 | -14.2 Pa |
Positive values mean uplift; the negative value means downforce. With the panel facing the wind, moving it to the roof center increased the mean uplift. Rotating the panel 180° strengthened the uplift at the edge; at the roof center, the net effect switched to downforce.
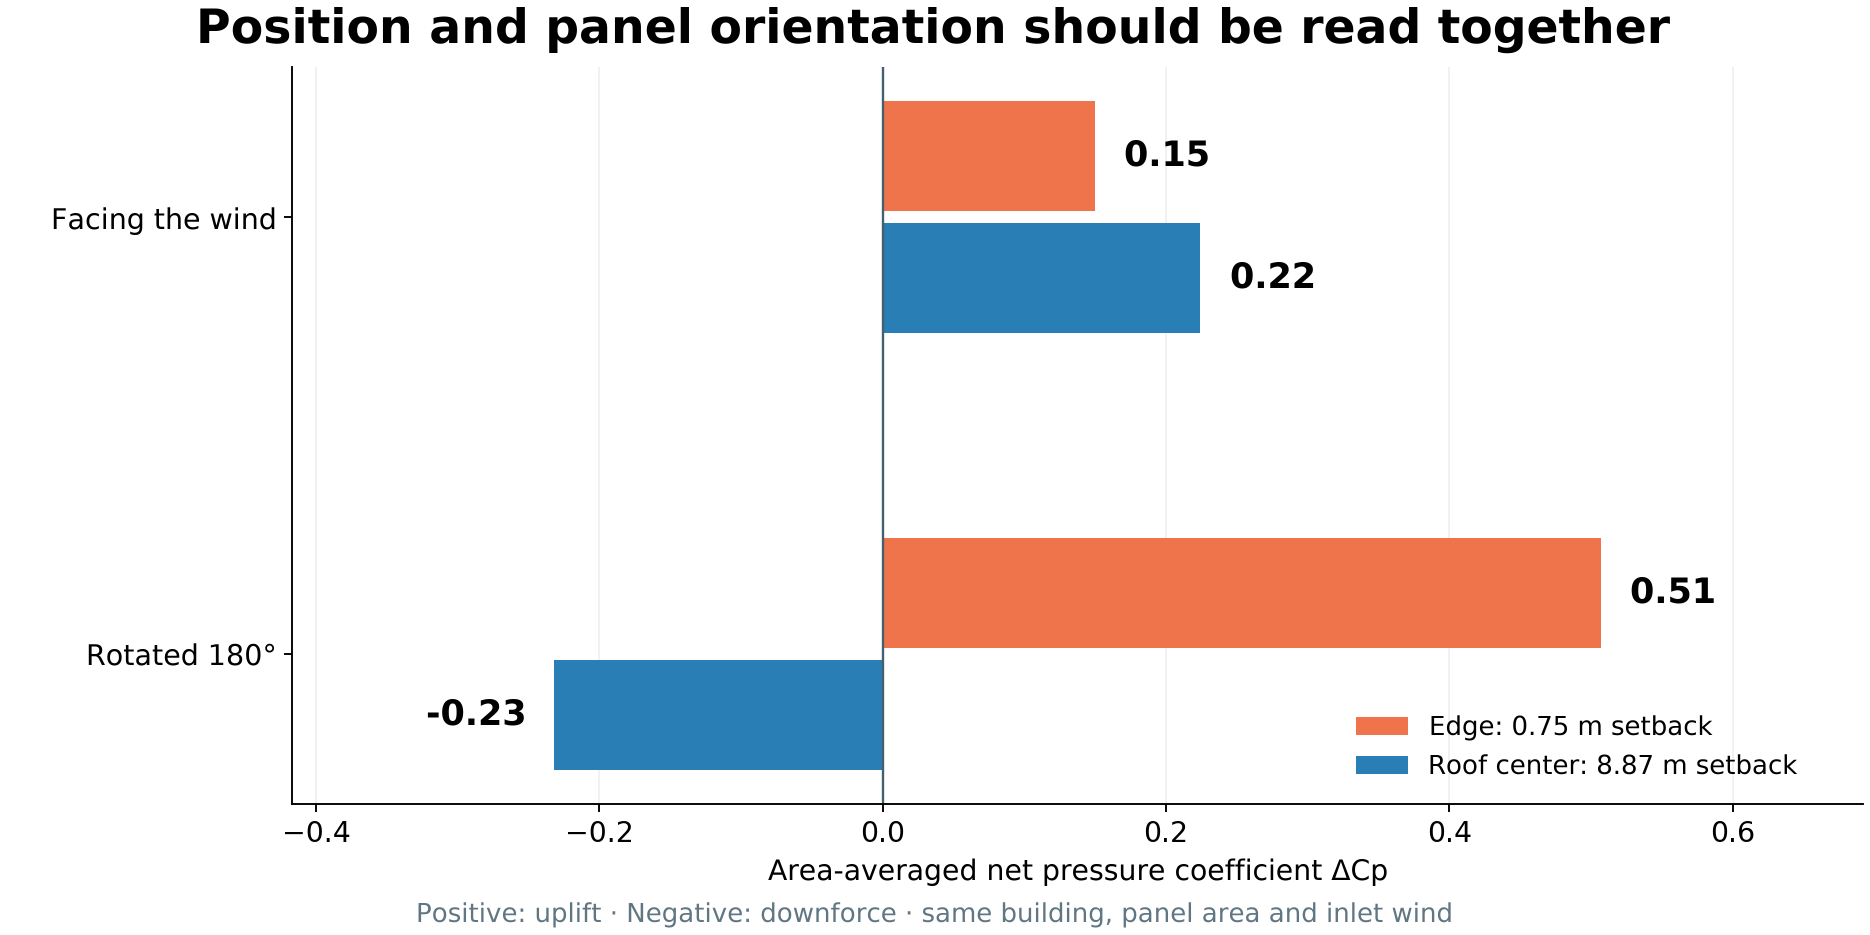
This example shows that the distance from the roof edge is not a sufficient criterion on its own. The panel’s position on the roof and its orientation need to be assessed together.
The results show the mean behavior in the selected wind direction for a single building without a parapet and a single panel. Sudden gusts, neighboring buildings and panel rows are not included in this comparison; the figures cannot be used as design loads for sizing the connections.
Methodology details and the validation chain belong to Alkazar. Related services: Facade Wind Loading (CFD & Eurocode) · Structure Wind Consultancy · Guide: wind load calculation, table and codes