

We carry out HEC-RAS based hydraulic modelling for rivers, stream channels, floodplains and project sites exposed to flood risk. By assessing the topographic, hydrological and structural characteristics of your project’s location together, we quantify which areas the water can spread to, what depths and velocities it can reach, and what effect it can have on critical structures and assets.
In short: HEC-RAS flood modelling combines design discharges derived from observed streamflow records with a high-resolution terrain model captured by LiDAR, and computes cell by cell where the water will go, at what depth and at what velocity under a given return-period scenario (Q100, Q500 and so on). The output feeds investment and design decisions directly, as maps and as a technical report.
When is it needed?
- When an investment, facility, infrastructure or settlement is planned near a stream channel
- When the flood exposure and threshold-level freeboard of an existing facility is questioned
- When the effect of a planned embankment, platform, wall, bridge or culvert on the flow has to be assessed
- When channel improvement, levee or flood-prevention alternatives need a technical comparison
- When flood risk has to be documented as maps and numbers for physical climate risk reporting
Site survey: producing terrain data with LiDAR
The single most critical input governing the accuracy of a flood model is not the software but the terrain data. Open-source digital elevation models (30 m or 12.5 m resolution) give a first approximation at catchment scale, but they cannot represent the features that actually govern flood behaviour: building entrance levels, basement ramps, facility thresholds, garden walls, road embankments and small levees. At that scale, sub-metre accuracy is required.
This is why we scan the site with LiDAR when a project of this kind comes in. The survey produces a point cloud of the terrain; ground classification then separates a digital terrain model (DTM) from a surface model (DSM) that also contains vegetation and structures. The resulting model is written directly into the HEC-RAS terrain layer as the base of the hydraulic model.
The second contribution of a LiDAR survey is that morphological change becomes measurable. When scans of the same site from different dates are compared, the change in bed elevation, the areas of deposition and scour, the fill and excavation volumes, the narrowing of the channel width and the post-intervention section capacity can all be extracted numerically. The difference between the before and after of an intervention (channel works, fill, a bridge, a platform) enters the model as a measurement rather than an assumption.
| Terrain data source | Typical resolution | What it can represent | What it cannot |
|---|---|---|---|
| Global open-source DEM (Copernicus-30 and similar) | ~30 m | Catchment boundary, main flow path, morphometric parameters | Urban flood propagation, risk at building scale |
| Satellite-based high-resolution DEM (ALOS PALSAR and similar) | ~12.5 m | First approximation of flood extent, coarse section geometry | Threshold levels, basement ramps, walls and small levees |
| UAV / LiDAR site survey | ≤1 m | Building thresholds, ramps, walls, fill, road levels, channel morphology; before-and-after difference analysis | The submerged channel bed (bathymetry is measured separately) |
Because standard LiDAR cannot see through the water surface, surveyed cross sections or bathymetry data are written onto the terrain separately so that channel capacity is computed correctly. Skipping this step biases channel capacity systematically.
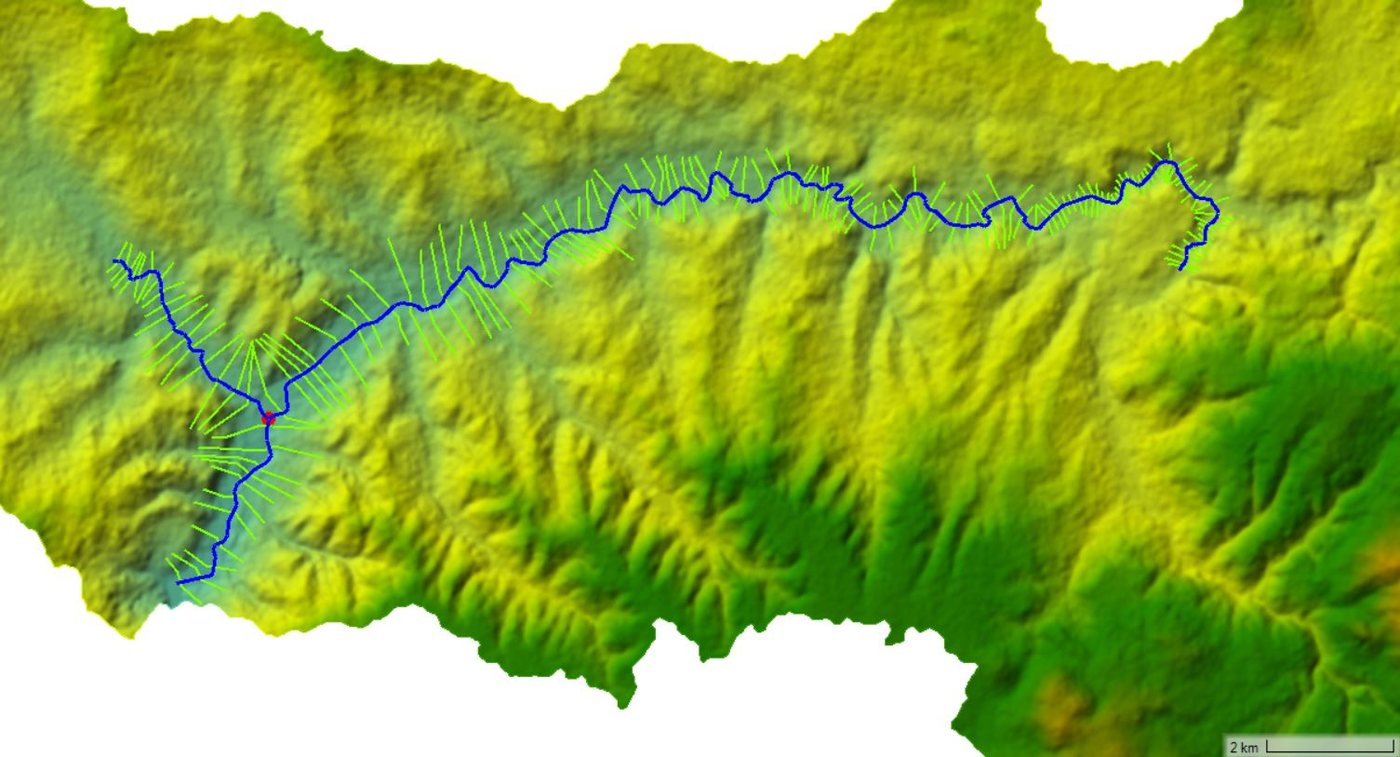
The modelling chain: from hydrology to hydraulics
A flood model is not a single calculation but a chain of two connected blocks. The hydrology block produces the design discharge and the hydrograph; the hydraulic block takes that hydrograph as a boundary condition and computes how the water spreads over the terrain. An error in any link is carried into every step that follows.
- Processing the observed streamflow data. Daily mean discharge series from the gauging station are cleaned, with checks for date continuity, duplicate records and missing days. The water year is defined from October to September, and the maximum discharge is extracted for each water year.
- Frequency analysis. Log-Pearson Type III and Gumbel EV1 distributions are fitted to the cleaned annual maxima series to compute the Q2, Q5, Q10, Q25, Q50, Q100 and Q500 design discharges. The choice of distribution weighs sample size, skewness, goodness of fit and regional hydraulic plausibility together.
- Instantaneous peak correction. A daily mean discharge suppresses the true within-day peak of a flood hydrograph. The Fuller relation converts the daily maximum into an instantaneous peak discharge. The correction factor depends on catchment area, and the difference grows markedly in small catchments.
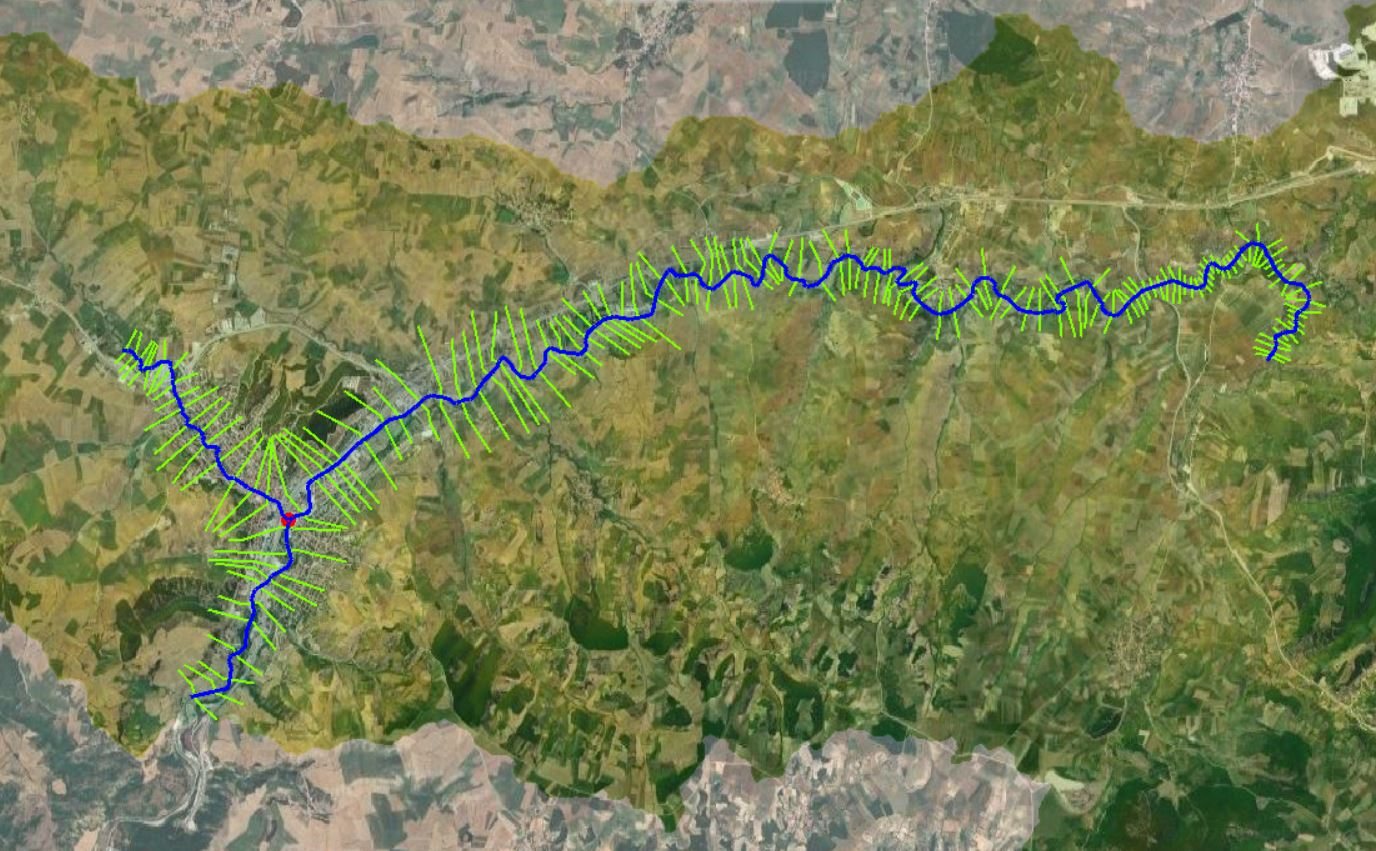
- Catchment delineation and morphometric parameters. The digital elevation model is hydrologically conditioned (sink filling, flow direction, flow accumulation); the upstream catchment boundary is derived for each inlet point, and area, main flow length, slope and relief are computed.
- Rainfall-runoff modelling. CN values are derived from land cover and hydrological soil group data; the hydrograph shape of each tributary is computed with the SCS-CN loss model and the unit hydrograph method.
- Calibration. The combined peak at the confluence is calibrated against the design discharge obtained from the frequency analysis of a long-record gauging station. This is the control point at which the rainfall-runoff model is not left free.
- Building the hydraulic model. The calibrated hydrographs are transferred as boundary conditions; terrain, geometry, roughness, computation interval and output intervals are defined.
- Running scenarios and mapping. Each return period and each intervention scenario is run separately; maximum depth, velocity, water surface elevation and flood extent maps are produced.
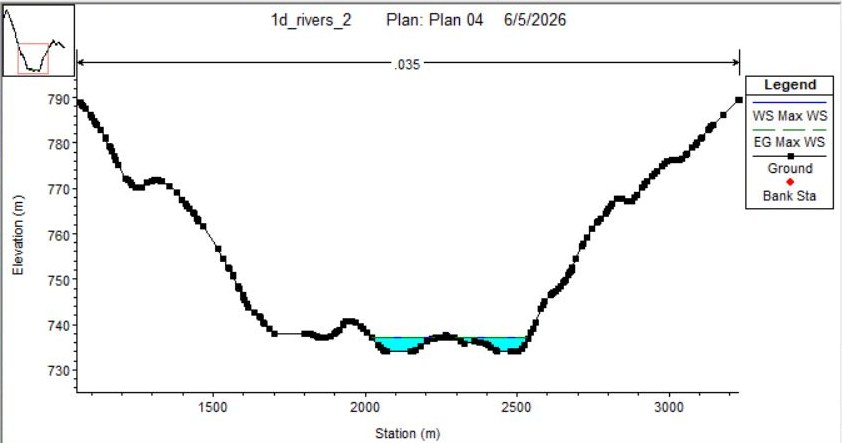
1D, 2D and coupled models: which and when?
The model scheme is chosen according to the purpose of the study. The wrong scheme produces the wrong answer even with the right data.
| Approach | When is it appropriate? | Critical points |
|---|---|---|
| 1D unsteady | A well-defined channel, section-based flow, longitudinal water surface profile and capacity analysis | Section ordering, bank station definition, Manning’s n, contraction and expansion coefficients, structure connections |
| 2D unsteady | Urban flood propagation, floodplains, areas where the flow direction changes freely | Cell size, breakline placement, terrain quality and the Courant number |
| Coupled 1D/2D | Where the main channel is represented in 1D and the floodplain in 2D | Lateral structure connection, weir crest elevation and correct placement of the connection |
Manning’s roughness coefficient
The roughness coefficient acts directly on water depth and flow velocity. Manning’s n values are assigned by land-cover class but checked against local observation. Using a single generic value for settlements, walled gardens, dense vegetation, channel bed lining and road surfaces is misleading.
Scenarios
The scenario set allows the model to evaluate not only the existing situation but also the design flood, the extreme flood, the effect of structures and mitigation alternatives. Only the input that changes is varied in each scenario, so that the difference in the result can be attributed directly to that variable.
| Scenario | Purpose | Input difference | Output |
|---|---|---|---|
| S0: Existing situation | Reference flood behaviour | Existing terrain and existing development | Baseline depth, velocity and water surface elevation maps |
| S1: Post-project | Effect of the project structures on the flow | Platform, wall, fill or structure effects written into the terrain model | Project-effect difference maps |
| S2: Q100 | Design flood | Q100 hydrograph | Risk maps for design and regulatory assessment |
| S3: Q500 | Extreme flood check | Q500 hydrograph | Residual risk and flood boundary |
Output maps
For each scenario we produce maps of maximum water depth, maximum velocity, maximum water surface elevation, flood extent, arrival time and hazard class. Maps are prepared on the same colour scale and in the same coordinate system; otherwise visual comparison between scenarios becomes misleading.
| Output | Technical meaning | What it is used for |
|---|---|---|
| Maximum depth | The greatest water depth seen in each cell over the simulation | Flood extent and damage potential |
| Maximum velocity | The greatest flow velocity seen in each cell | Erosion, entrainment and structural risk |
| Maximum water surface elevation | Absolute water surface level | Comparison against threshold levels and freeboard calculation |
| Arrival time | The time at which the water reaches a given cell | Early warning and evacuation planning |
| Flood extent | The outermost boundary the flood reaches | Planning, restrictions and development decisions |
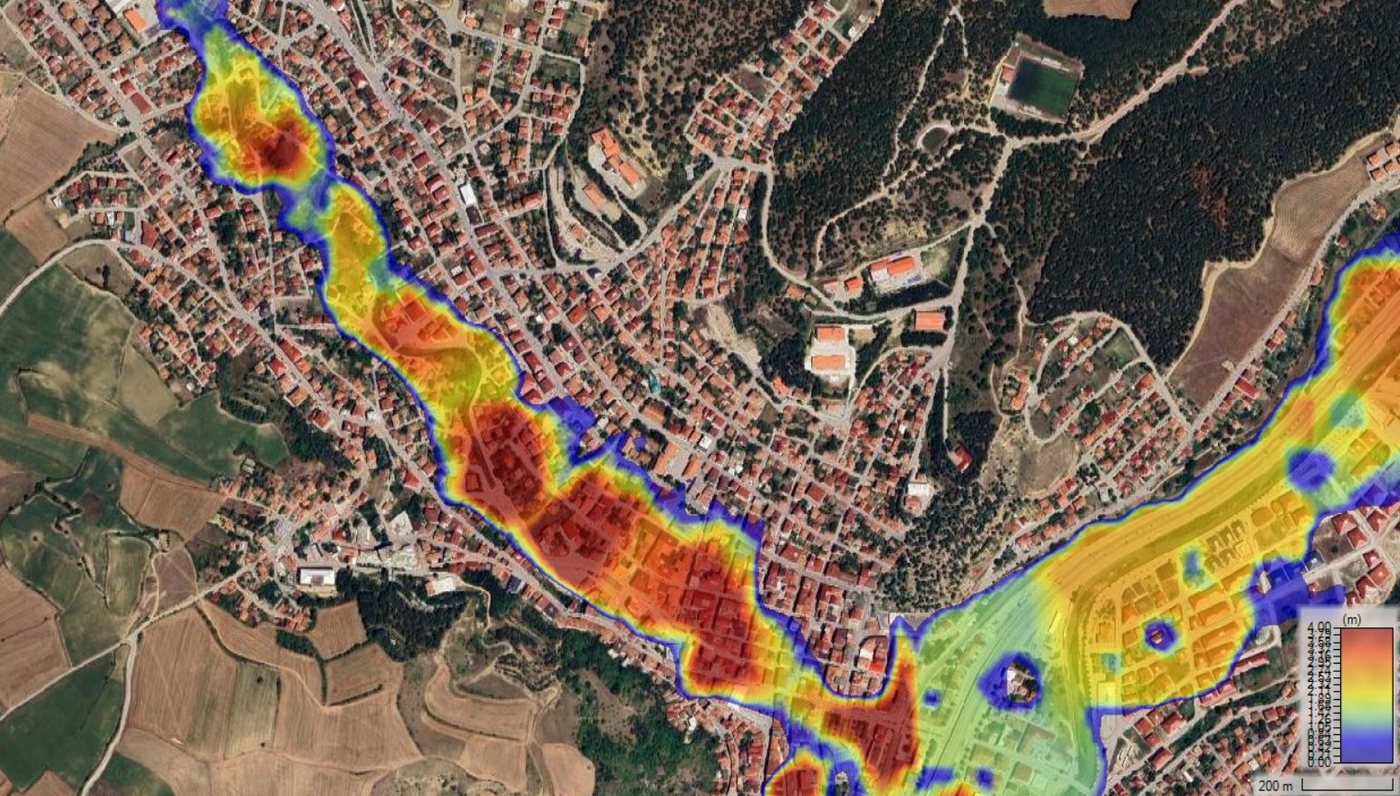
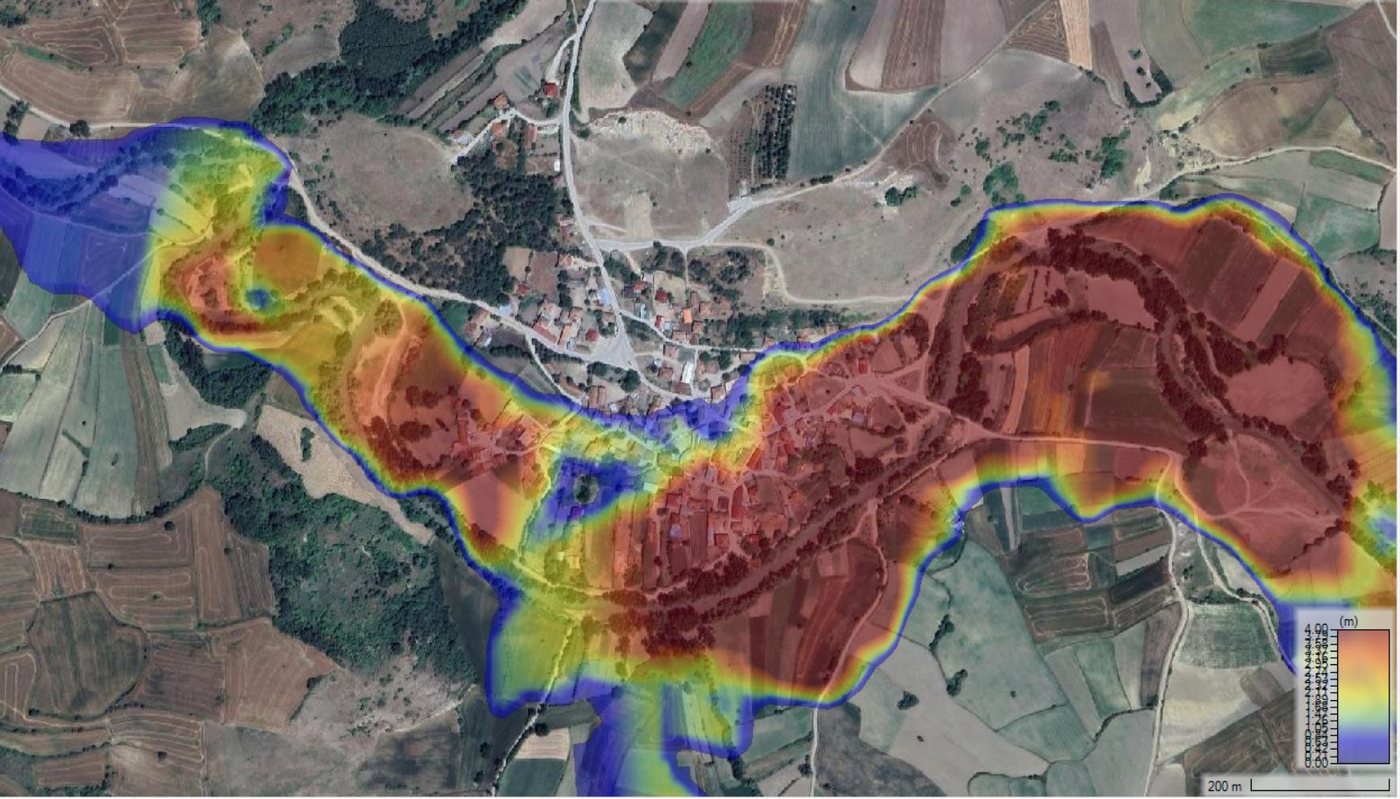
Asset-based risk assessment
Risk cannot be assessed by looking at the flood boundary alone. A structure inside the flood boundary may take no water if its threshold level is high enough, while a structure just outside it may be affected because it sits in a local depression. For each critical asset, therefore, the maximum water surface elevation, the local ground level, the entrance or threshold level and the freeboard are assessed together.
Freeboard = threshold level − maximum water surface elevation. A positive value is the safety margin; a negative value indicates flooding risk. For this calculation to mean anything, the threshold level and the terrain model must share the same vertical datum, which is precisely why the LiDAR survey is decisive at this point.
Quality criteria: a model that runs is not enough
A completed computation does not mean a correct result. Before a model is accepted, the mass balance, water surface continuity, the physical consistency of the velocity field and the stability records are assessed together. Because horizontal and vertical datum consistency acts directly on water surface elevation and depth, all raster, vector, cross-section and threshold-level data must share the same coordinate system and the same vertical datum.
The same principle applies on the data side. Whether an outlier maximum discharge in a hydrometric series is a real flood or a measurement error is assessed together with meteorological consistency, neighbouring stations and the catchment mass balance. If an outlier is to be removed from the analysis, its date, value and the reason for removal are stated in the report. The aim is that another specialist can reproduce the same model from the same inputs.
Where is it used?
Flood and hydraulic modelling is used in infrastructure projects, industrial facilities, energy investments, transport corridors, port areas, settlements and planning processes around stream channels. A hydraulic analysis prepared specifically for the project area allows flood risk to be seen at an early stage, investment decisions to rest on more reliable technical data, and workable engineering measures to be developed against the risks identified.
Data required for the study
- The project area boundary and, where available, existing survey drawings, site layout and level information
- The name of the river or stream and, where available, gauging station records
- Existing surveyed cross sections or bathymetry data, where available
- Bridges, culverts, levees, channel works and their geometry
- Entrance and threshold levels for critical structures (measured as part of the LiDAR survey if not available)
- Planned development, fill, platform and wall projects
The study can proceed even if some of these are missing; missing data is defined as an assumption in the model and the report states clearly which result depends on which assumption.
Frequently asked questions
- Is 1D or 2D better?
- Neither is better; they answer different questions. If the question concerns the water surface profile along the river and section capacity, 1D is more efficient. If the water will spread through a settlement into streets, courtyards and between embankments, and the flow direction changes freely, 2D is required. Where the main channel and the floodplain behave differently, a coupled 1D/2D model is built.
- Why LiDAR? Is open-source satellite data not enough?
- Open-source digital elevation models can be sufficient to see the first picture of flood propagation at catchment scale. Whether a building takes water, however, is decided by a difference of tens of centimetres between the threshold level and the water surface elevation. A terrain model at 12.5 m or 30 m resolution cannot carry that difference. If the decision is to be made at facility or building scale, sub-metre terrain data is required.
- Can a study be done without a LiDAR survey?
- Yes. Studies aimed at catchment-scale extent and prioritisation can be carried out with existing open-source terrain data. In that case the report states explicitly which terrain resolution the results rest on and that they are not valid for decisions at building scale.
- What is before-and-after morphology analysis for?
- Comparing LiDAR surveys of the same site from different dates yields the change in bed elevation, the zones of deposition and scour, the fill and excavation volumes and the change in section capacity as numbers. The effect of channel works, a fill or a bridge on the flow is then measured rather than estimated.
- What does Q100 mean?
- Q100 is the discharge with a 1% probability of being exceeded in any given year, commonly called the 100-year flood. It does not mean “it happens once in a hundred years”; two consecutive years are statistically possible. It is the reference return period most widely used in design and regulatory assessment.
- In what format are the results delivered?
- As flood maps usable in a geographic information system (GIS), together with technical figures and a report containing the engineering assessment. The report covers the data inventory used, the method steps, the calibration results and the assumptions and limitations.
- Is this service independent of the UrClimate products?
- Yes. HEC-RAS based flood and hydraulic modelling is a standalone engineering service delivered on a project basis. If required, the results can be connected to risk quantification through UrClimate Score and UrClimate Next.
Related content
- Flood and Groundwater Risk Analysis: Process-based water risk assessment at catchment and parcel scale.
- Meteorology & Climate Data: The observation and climate data layer the models rest on.
- All Solutions: The full directory of our services.