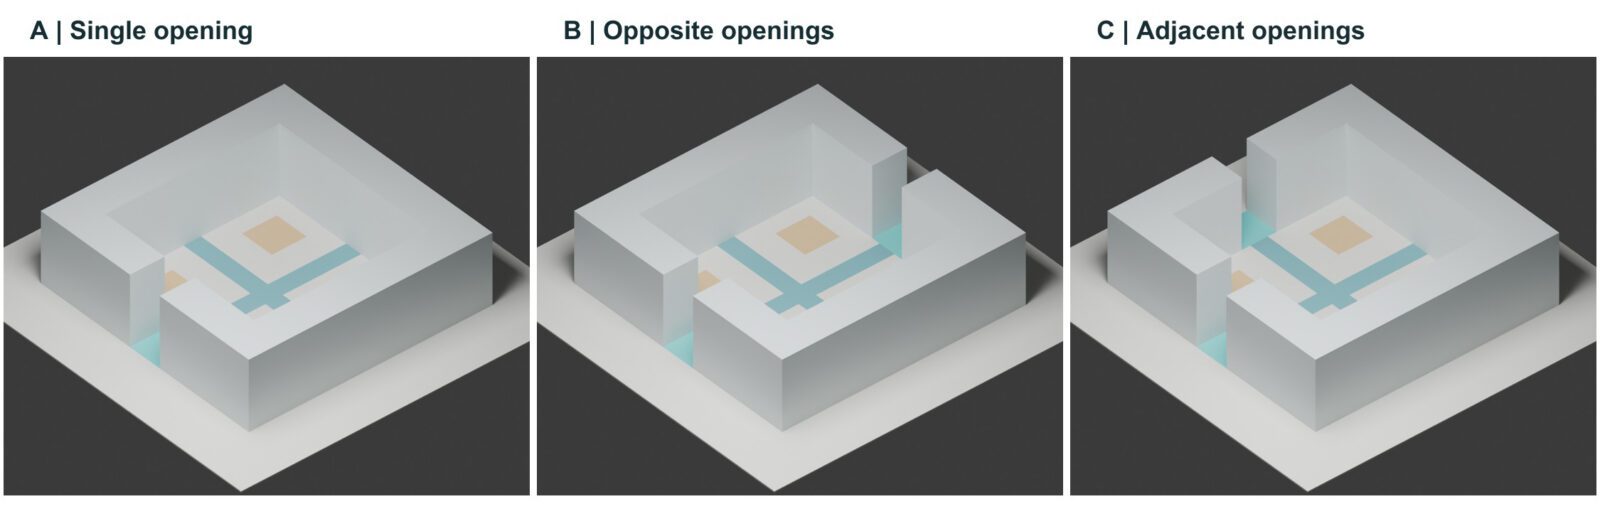
Does calming the courtyard mean calming all the use areas at the same time? We examine how placing two openings of the same size on opposite or on adjacent facades changes the wind in seating areas and on walkways. Unlike the facade pressure question in Alkazar’s article on neighboring building orientation, our focus is the pedestrian level inside the courtyard.
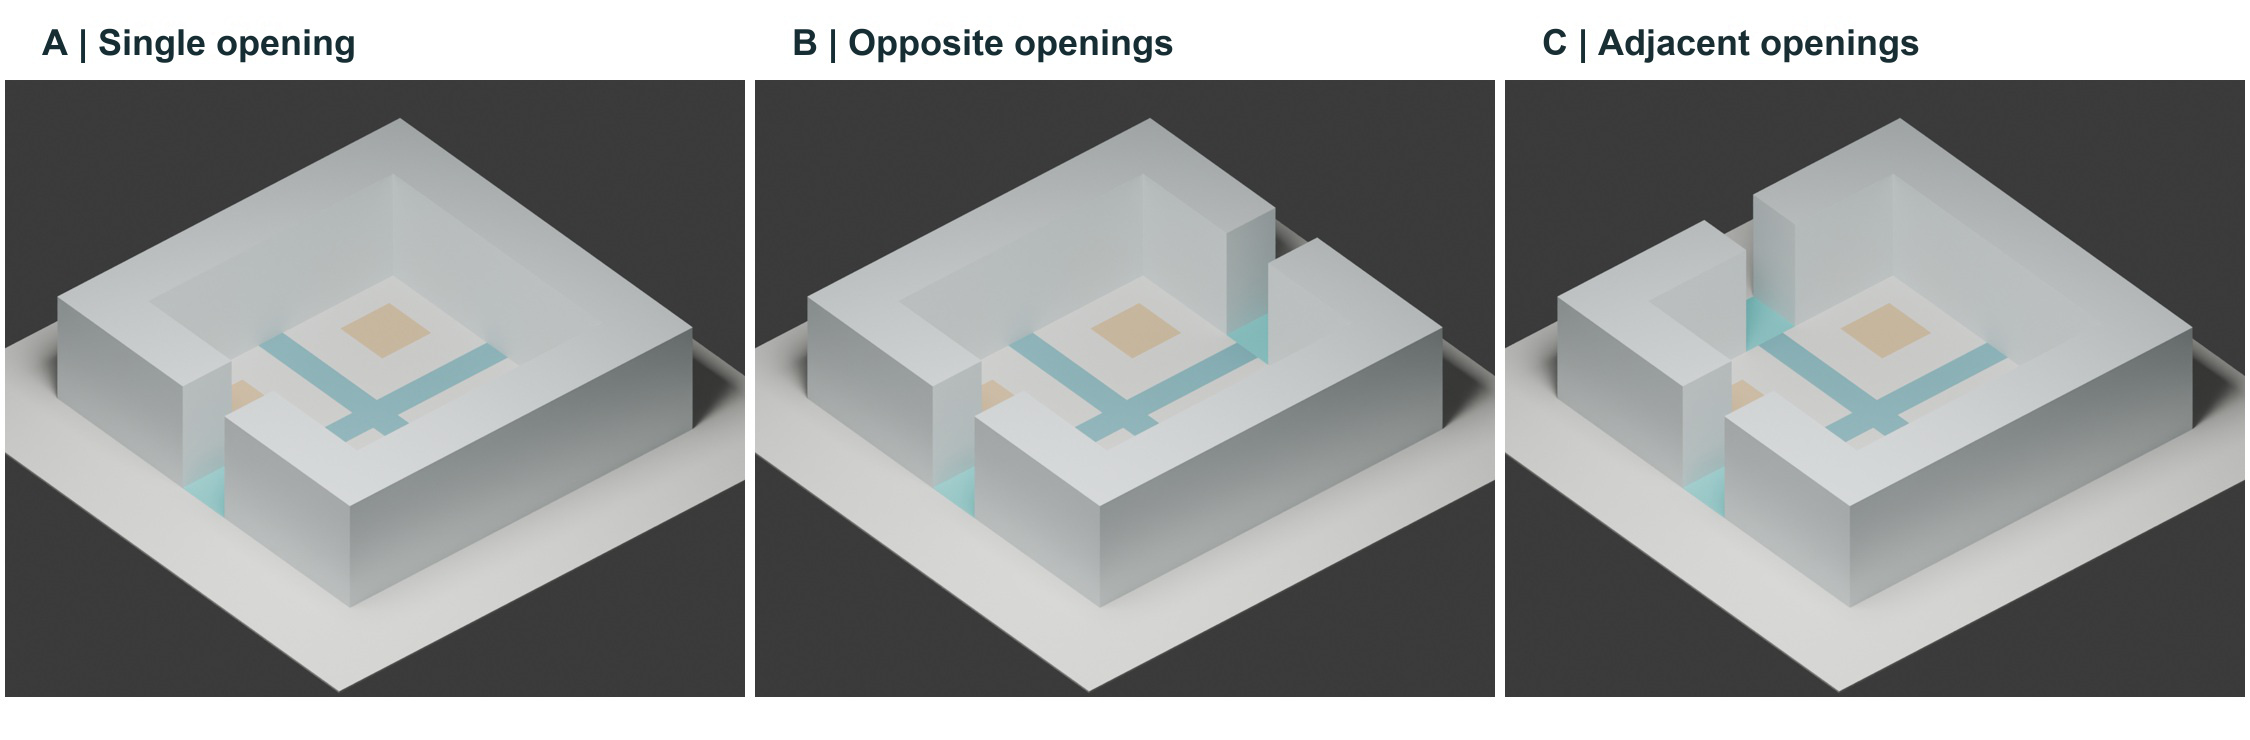
The courtyard is 30 × 30 m and the building is 12 m high. Each opening is 6 m wide and open from ground to roof. In the two-opening layouts, the dimensions of the openings are kept fixed; only the facades they are placed on change. In B the openings are on the west and east facades, in C on the west and north facades. The single west opening in A is a reference of the same width.
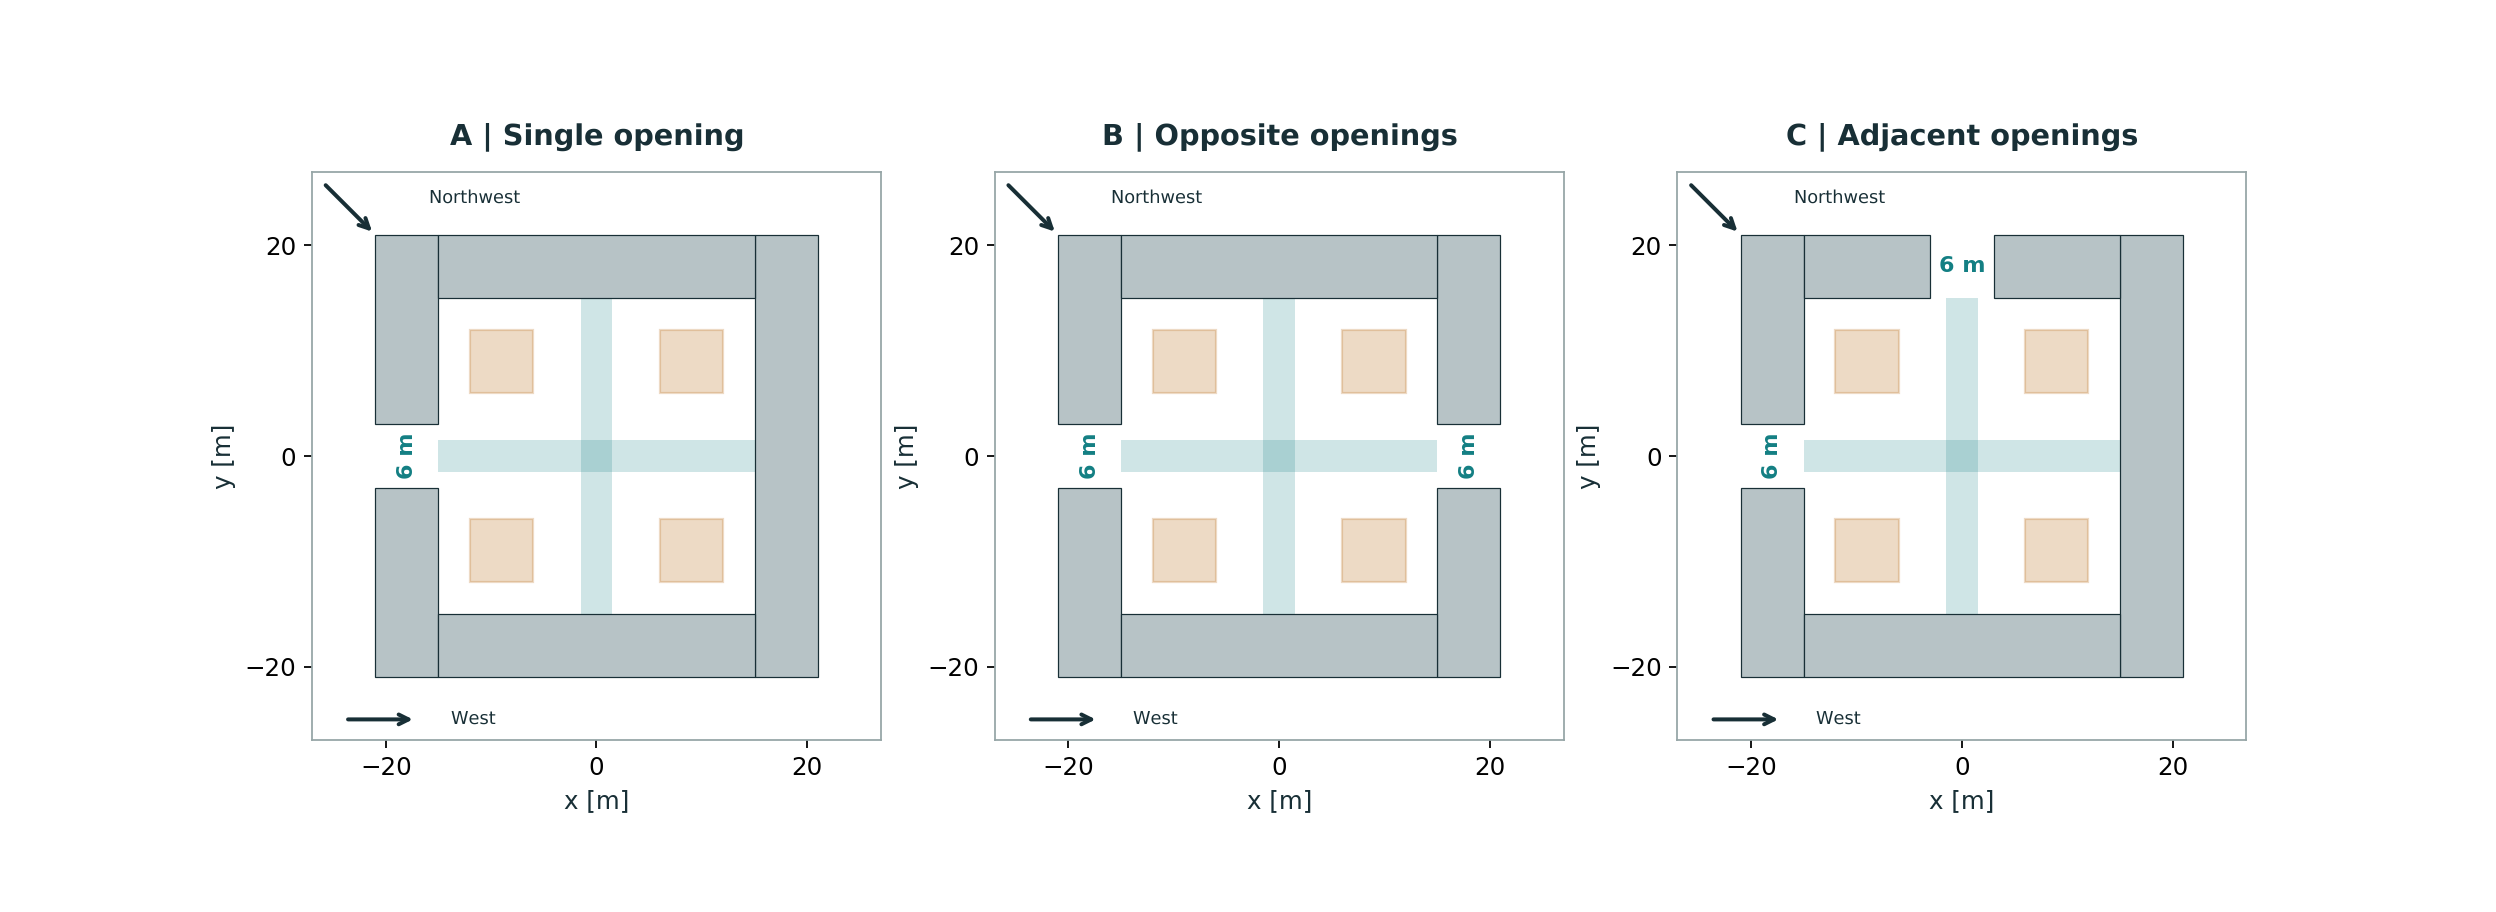
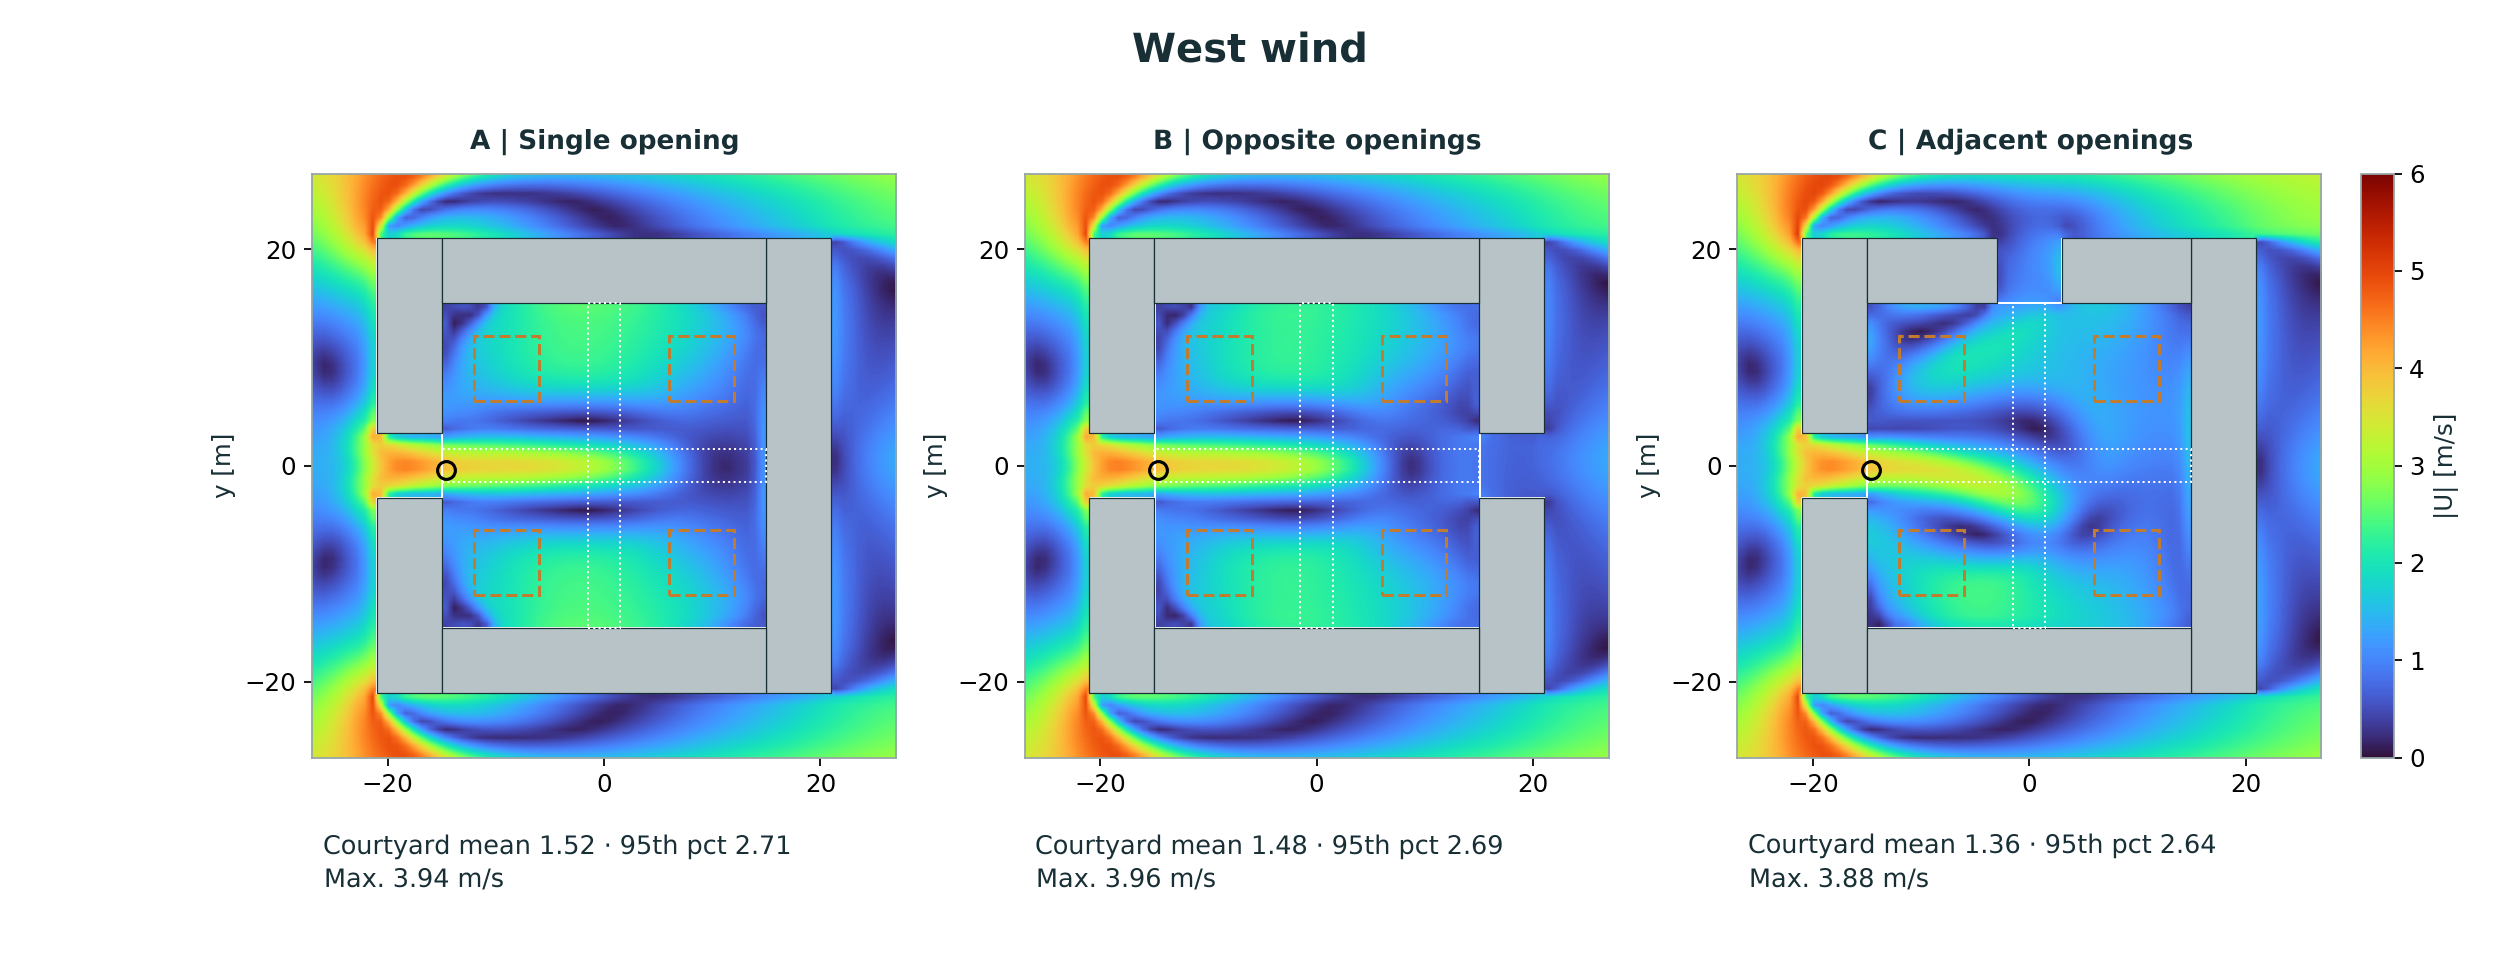
The orange squares are seating zones and the strips in the center are walkways. They are in the same place in every layout; furniture and trees were not modeled. The reference wind is 5 m/s at 10 m. The maps are at a height of 1.5 m and on a common 0–6 m/s scale in both directions.
In the west wind, the walkway means of B/C are 1.99 / 1.76 m/s and the seating means are 1.52 / 1.34 m/s. The highest local speeds at the opening and in the zone extending just inside are 4.49 / 4.41 m/s. On the map, the mean and the acceleration around the opening need to be read together.
Although the seating mean drops, the seating 95th-percentile speed stays about the same (2.06 / 2.04 m/s); the local seating maximum rises from 2.13 to 2.34 m/s.
When the wind direction changes, the ranking changes too
In the northwest wind, moving the two openings from opposite facades to adjacent facades lowers the seating mean from 1.52 to 1.29 m/s (about 15%); the seating 95th-percentile speed also decreases from 2.64 to 2.04 m/s (about 23%). In contrast, the walkway mean rises from 2.11 to 2.28 m/s. A decrease in one use zone does not automatically carry over to the other.
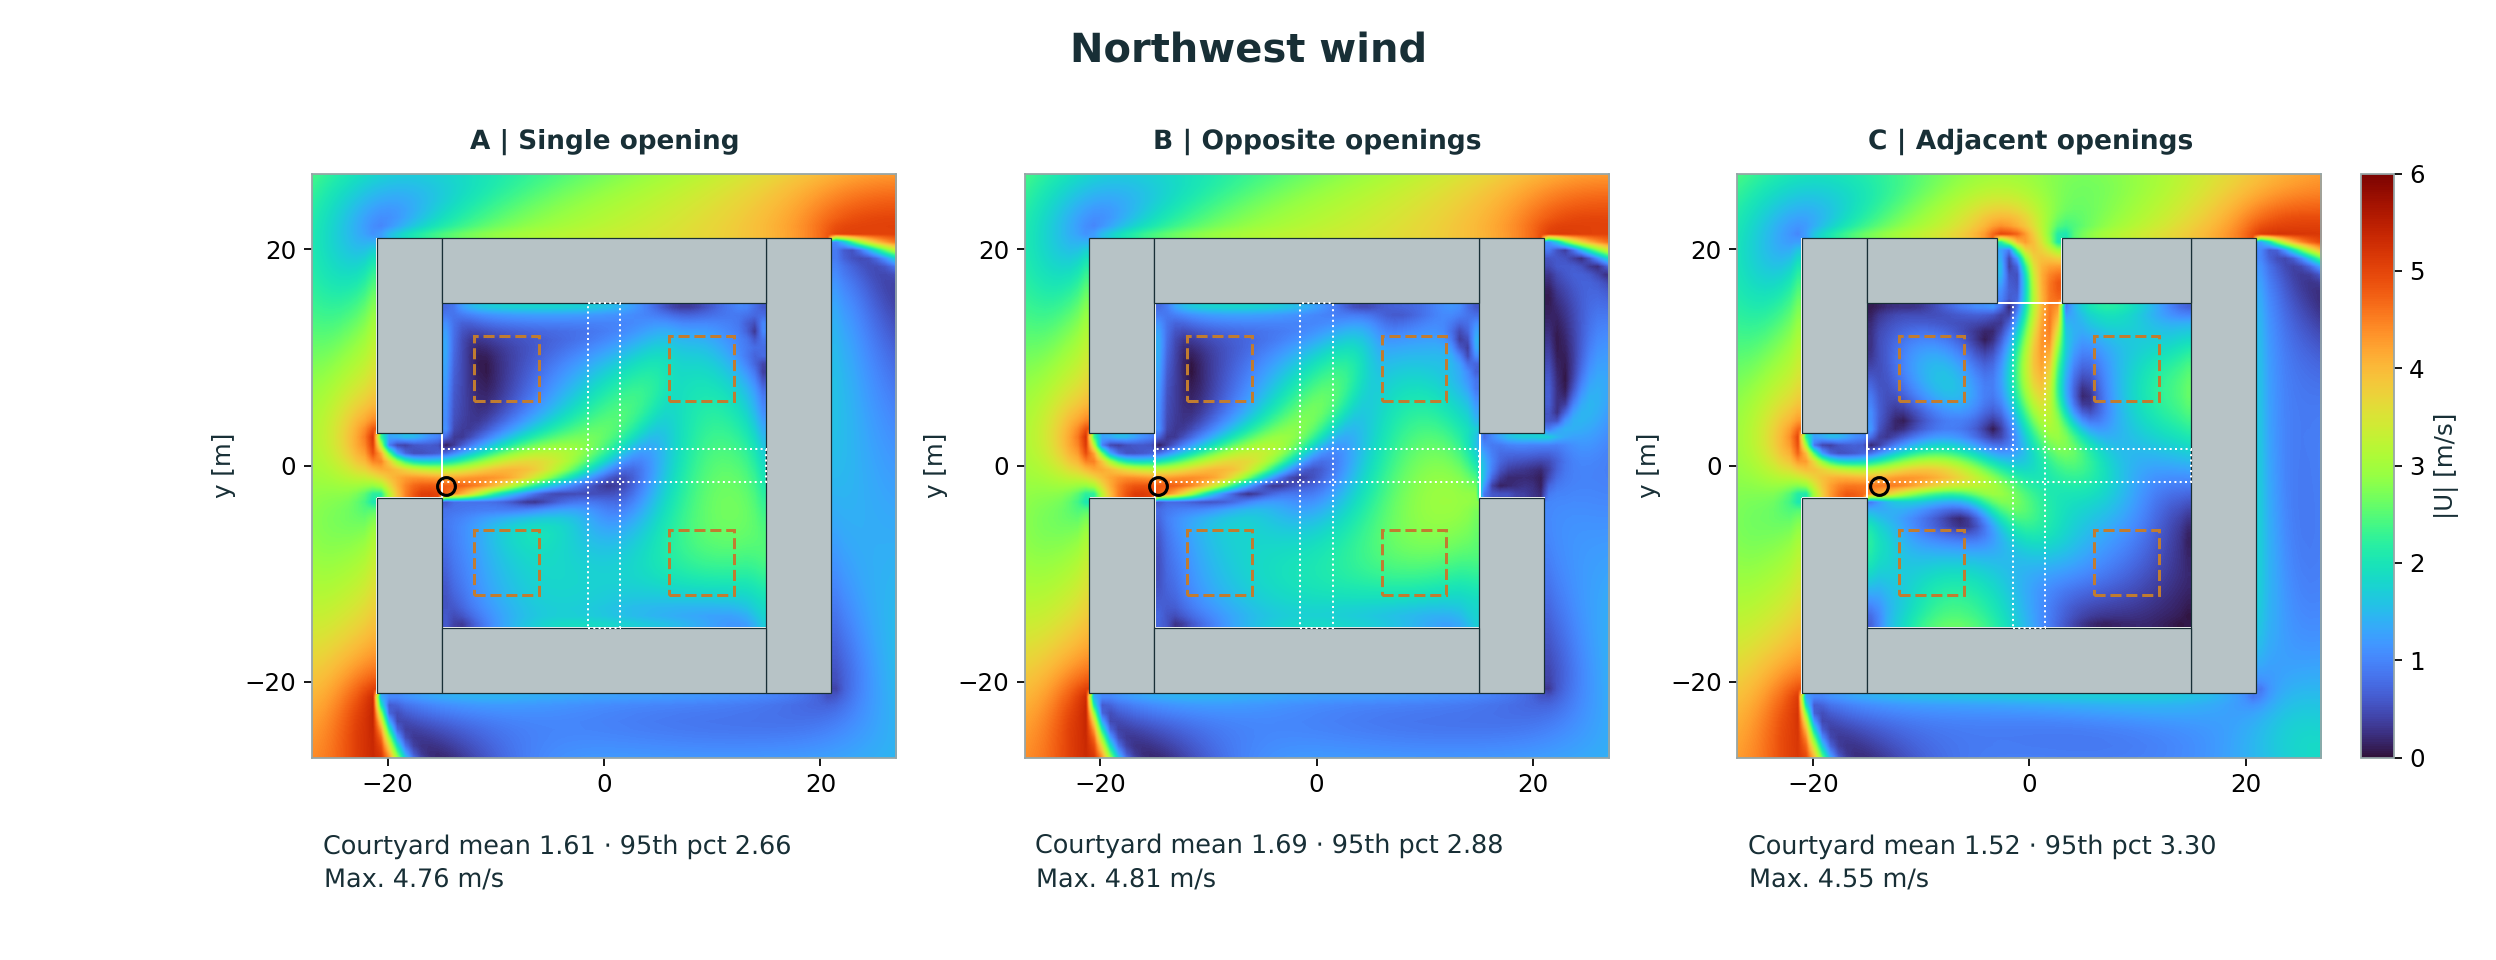
The location of the calm zone also changes: in the northwest wind, the mean of the southeast seating square is 2.42 in B and 0.80 m/s in C. The seating/walkway means of the single-opening layout A are 1.58 / 2.02 in the west wind and 1.48 / 2.02 m/s in the northwest wind; A is shown in the chart as a reference of the same width.
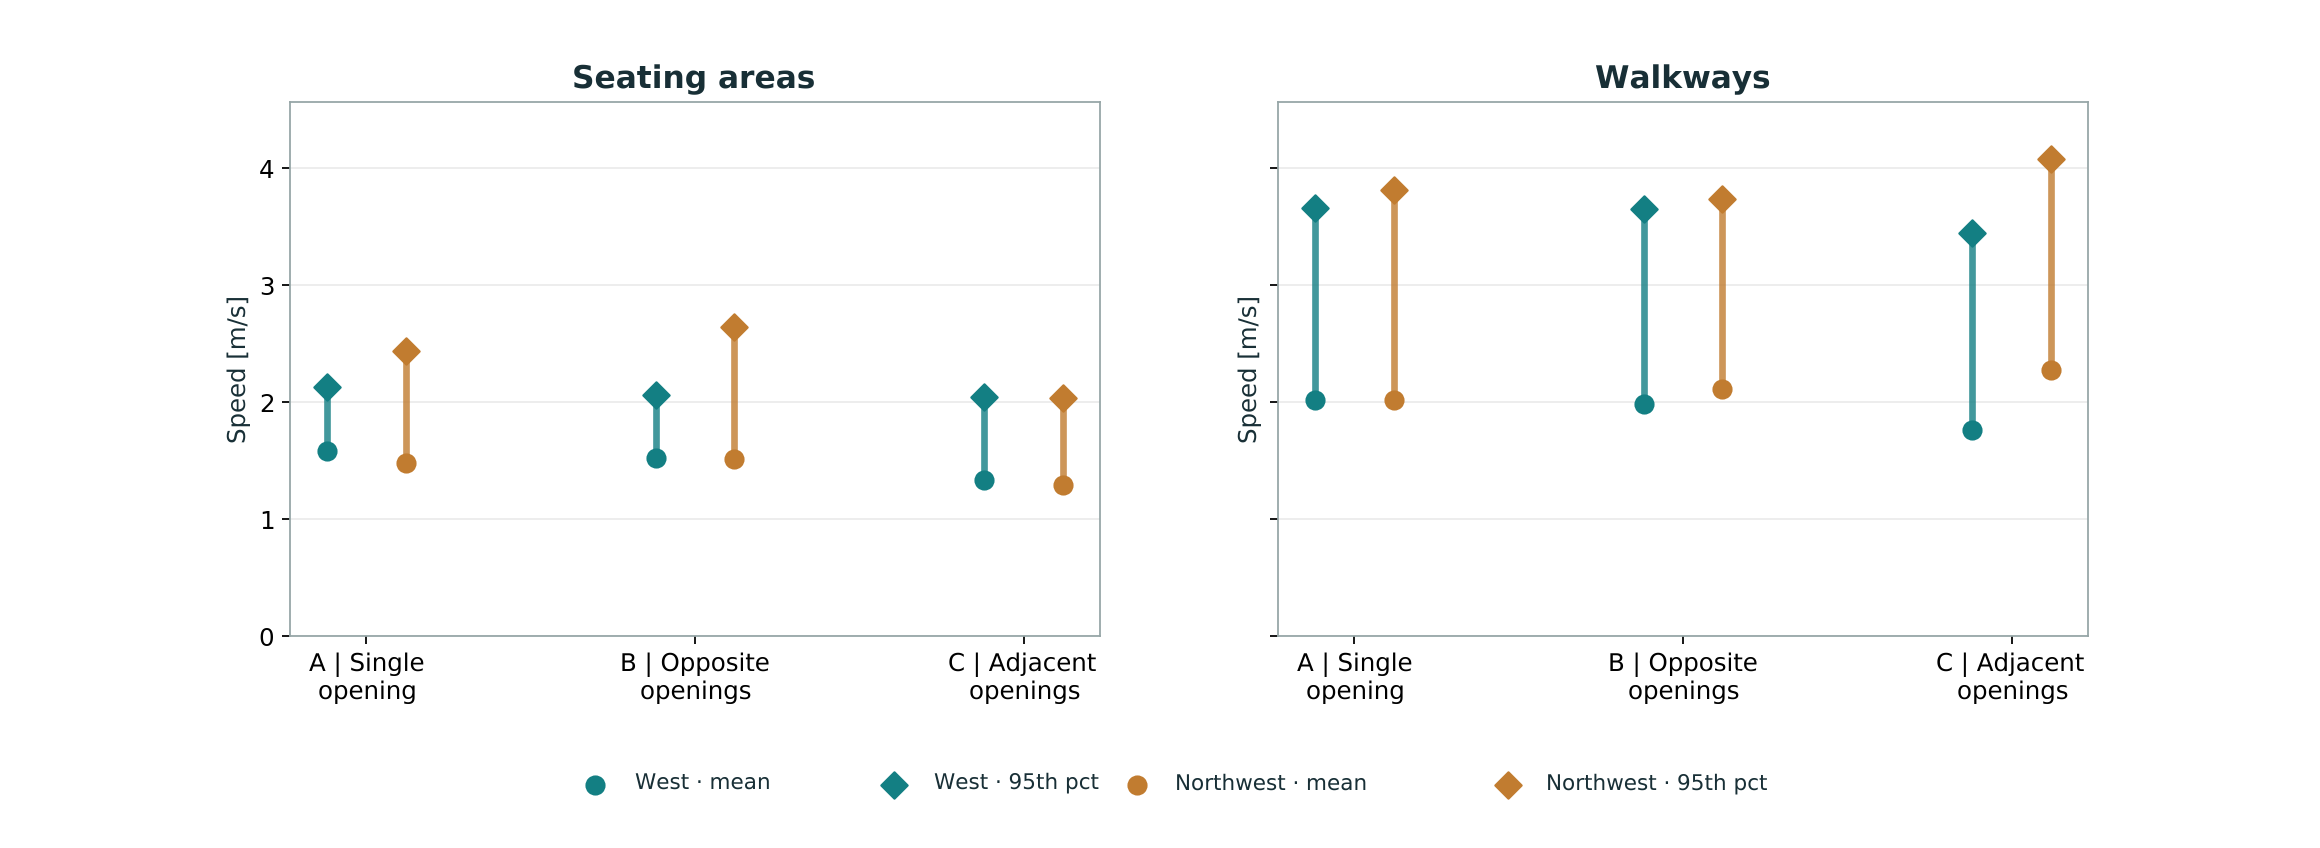
The 95th percentile is the speed that is not exceeded over 95% of the area; it is not an annual exceedance probability. The ring in the maps separately marks the highest local speed in the courtyard.
The moving dots in the animation show the mean air movement at a height of 1.5 m. Air passing over the roof and sudden wind changes are not included in the animation.
In this example, the choice of facades for the openings should be assessed by how the wind accelerating around the opening affects the seating and walkway areas. The examined directions and use zones should be read together; a single mean speed value for the courtyard is not enough to show the differences in these use areas.
This comparison is limited to a representative courtyard and two wind directions. Without local wind statistics, no annual comfort class is given.
Methodology details and the validation chain belong to Alkazar. Related services: Pedestrian Level Wind Comfort · Outdoor Comfort