

Alkazar · October 2026 · Preliminary study
We rebuilt the flood of 14 October 2026 on Istanbul’s Kağıthane Stream on a computer. The maps show where the water went that evening, in what order, and how unusual the flood was.
A long spell of heavy rain that began on the night of 13 October 2026 and intensified on the evening of 14 October hit the northern side of Istanbul. Kağıthane is a densely built district on the city’s European side. The Kağıthane Stream, which shares its name, rises in the Göktürk and Kemerburgaz forests to the north, runs down the Cendere valley, passes Ayazağa and the centre of Kağıthane, and empties into the Golden Horn (Haliç), the inlet that separates the old city from the rest of the European shore. That evening the stream burst its banks at many points along the way. Lives were lost in the storm. We remember those who died with respect and extend our condolences to their families.
In the days that followed we asked three questions: what happened along the stream that evening, where did the water go and in what order, and how unusual was this flood? To get closer to answers we rebuilt the event on a computer with a flood model. What follows are the results of that preliminary study, written for readers who are not hydrologists. In the second half of the article we also touch briefly on the decisions that maps of this kind can support.
The short answer
- Rainfall: Our catchment-average estimate from weather station records is about 172 mm over 24 hours. By regional rainfall statistics, that is an amount expected once in 135 years or so.
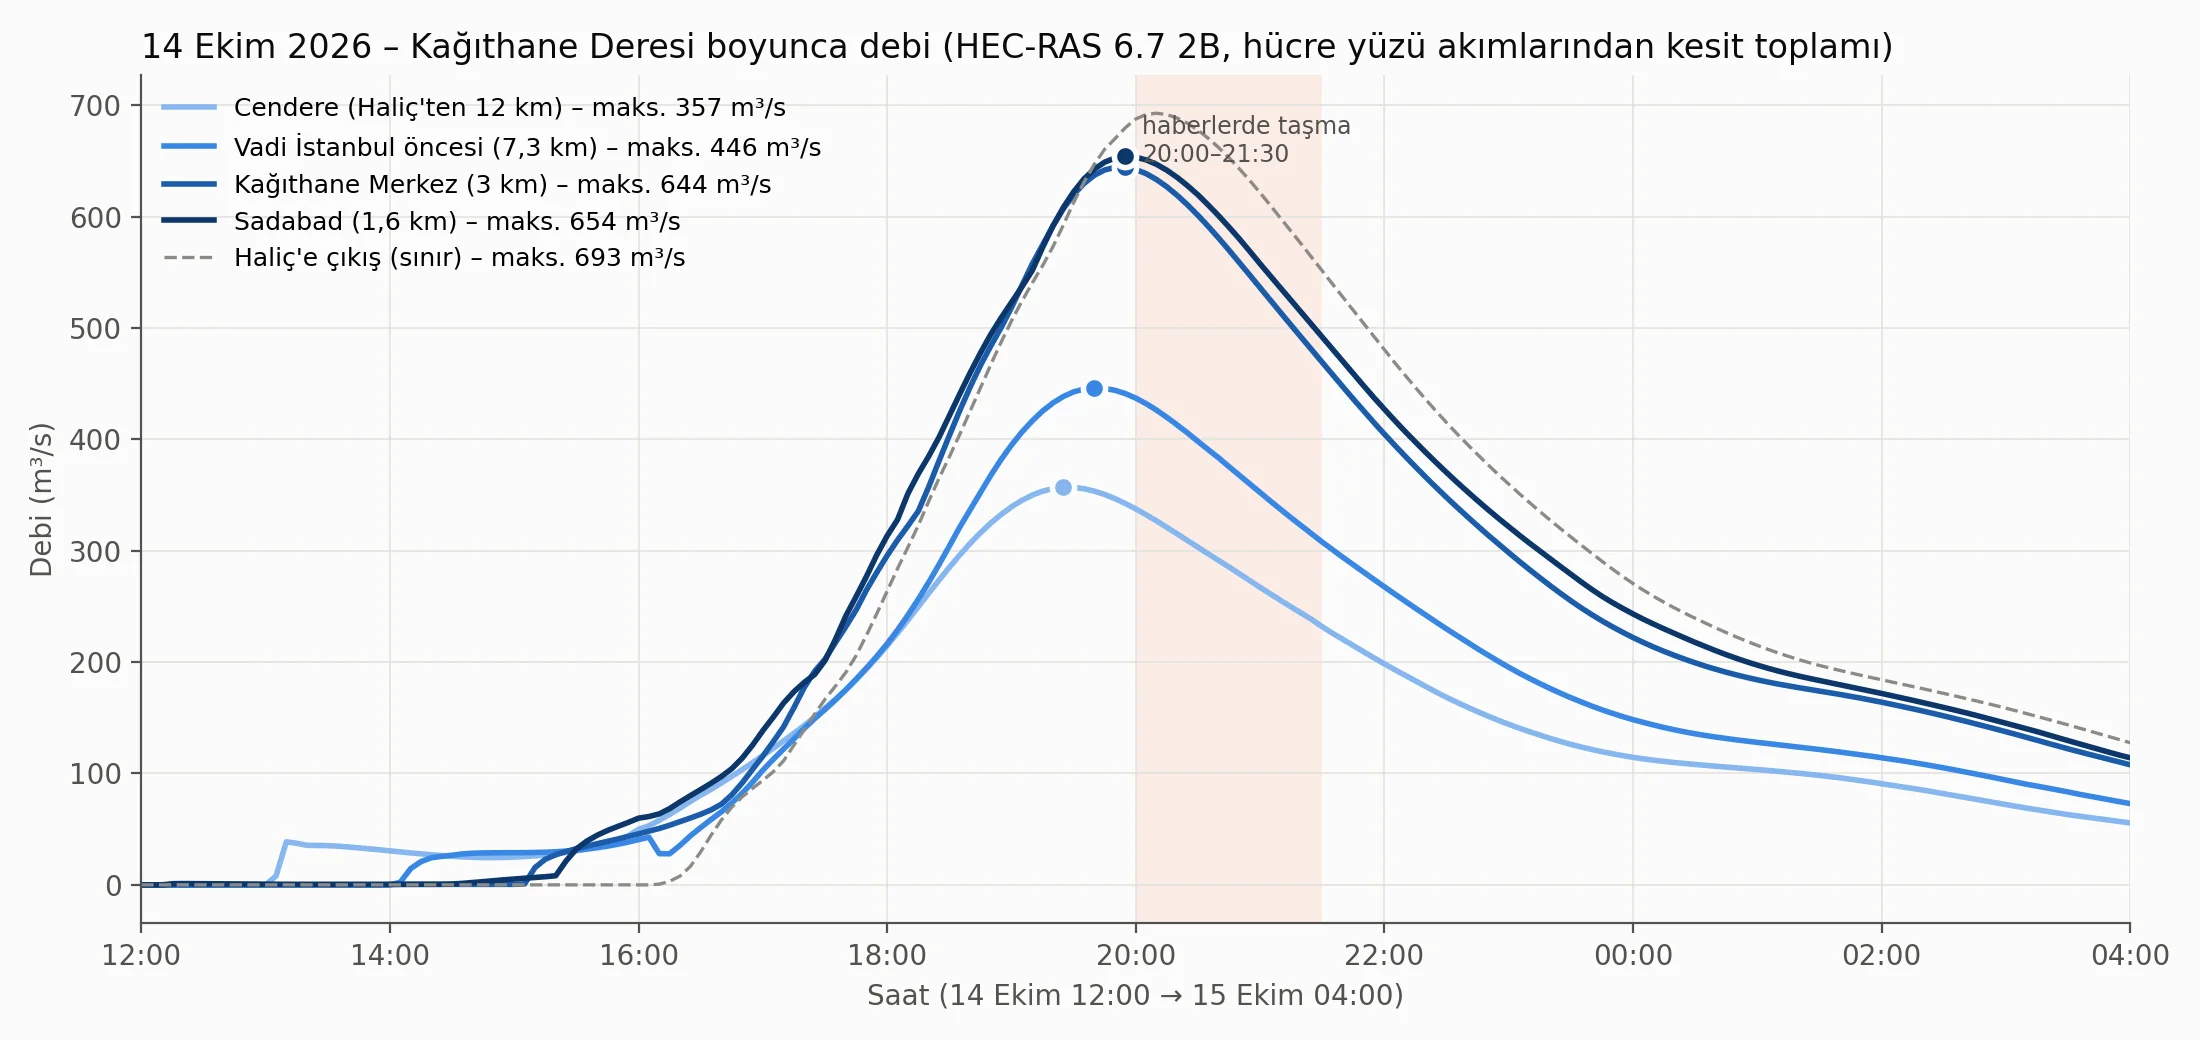
- Discharge: The model estimates that where the stream meets the Golden Horn, flow reached 650 to 700 cubic metres per second at around 20:00 on 14 October.
- Return period: On the first method’s design curve, this was a flood of the size expected once in 100 years on average (plausible range 60 to 140 years); the second method, which gives lower design flows, would make the event rarer.
- Consistency: All five press-reported flooding locations that fall inside the model area appear under water in the model results, and the model places the highest water about half an hour to an hour before the reported flooding.
- Impact: The model estimates that about 164 hectares outside the stream channel were flooded, with some 315 buildings and some 20 critical facilities inside the flooded area.
- Comparison: According to the model, and on the first method, the footprint of the 14 October flood almost coincides with that of a 1-in-100-year flood; on the second method the event exceeds the 1-in-100-year flood.
- Limits: Channel depths and bridges have not yet been surveyed; the figures should not be used directly for planning or investment decisions.
Rainfall: the story of a day, not an hour
Rain fell in two waves that day: a first wave in the morning, then a second that began in the afternoon and peaked in the evening. It was the second wave that drove the flood. The heaviest rain fell between 17:00 and 18:00 on 14 October, when the catchment average for that single hour is estimated at more than 30 mm.
What made the event unusual, though, was not the intensity of any one hour but how long the rain kept coming. One concept helps here. The return period of a rainfall or a flood is the average number of years you would expect to wait between events of that size over the long run. The wettest single hour was something you would expect once in 9 years; the 24-hour total was closer to once in 135 years. Broadly, the longer the window, the rarer the event; the 24-hour total is the rarest.
| Duration | Catchment average (mm, approx.) | Average return period (approx.) |
|---|---|---|
| 1 hour | 34 | once in 9 years |
| 3 hours | 70 | once in 40 years |
| 6 hours | 96 | once in 65 years |
| 12 hours | 120 | once in 65 years |
| 24 hours | 172 | once in 135 years |
Table 1. Return period of the 14 October 2026 rainfall over different durations, based on regional rainfall statistics with the size of the catchment taken into account. Model estimate (preliminary study).
We used hourly records from seven weather stations around the catchment. Rainfall totals reported in the press are consistent with these records; at some stations close to the catchment the daily total reached 180 to 190 mm. The days before the storm had been dry; how that enters the calculation is covered in the limits section below.
Along the stream that evening: the journey of the water
The Kağıthane Stream drains an area of some 163 km². The northern part of the catchment is forested; the south is densely built up. That contrast sets the pace at which water reaches the stream: in the forested tributaries it takes 2 to 4 hours for rain to gather into the channel, while in the urban reach it takes about an hour, and a larger share of the rain runs straight off the surface.
In the model we can follow the flood wave through its discharge, the volume of water passing a point each second, measured in cubic metres per second (m³/s). One cubic metre of water weighs roughly a tonne. In the model, flow peaks at Cendere at 19:25 and at the outlet to the Golden Horn at 20:10; tributaries joining along the way roughly double it. Where the stream meets the Golden Horn, discharge reached 650 to 700 m³/s at around 20:00, which is on the order of 650 to 700 tonnes of water every second. The peak came two to three hours after the heaviest rain; water falling across a large catchment takes time to gather and reach the stream.
How the event was rebuilt on a computer
We rebuilt the event in HEC-RAS, a widely used flood modelling package, as a two-dimensional hydraulic model, with a one-dimensional model alongside it as a cross-check. A hydraulic model is a computer model that calculates where the water goes, how deep it gets and how fast it moves. The “two-dimensional” part matters in a city: water that leaves the channel does not follow a single line; it spreads into streets and squares and finds its way between buildings. The maps and impact figures below therefore come from the two-dimensional model, in which water is free to flow in any direction.
The model covers the valley floor from the Golden Horn to some 16 km upstream, plus the last 3.5 km of the Ayazağa Stream, a tributary. That area is divided into roughly 43,000 cells averaging 15 m across. We derived a 10 m computational terrain from a 30 m open, satellite-derived elevation model and placed some 28,500 buildings in it as obstacles the water has to flow around. Channel widths were read from satellite imagery; channel depths are, for now, assumptions. The same model was then run for floods expected once in 50, 100, 500 and 1,000 years.
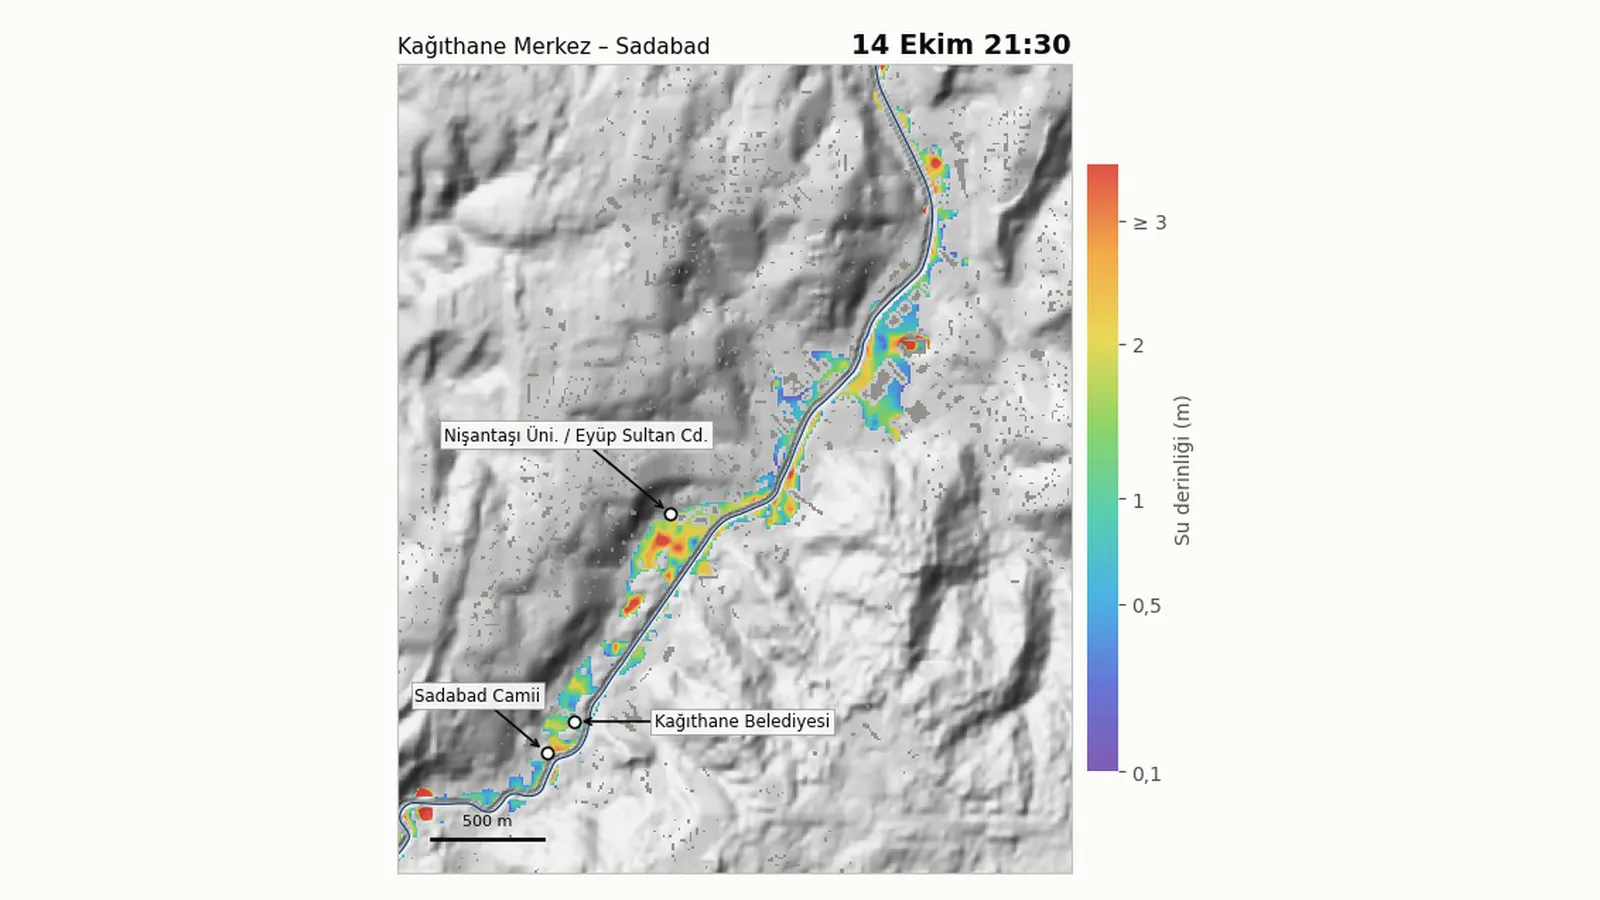
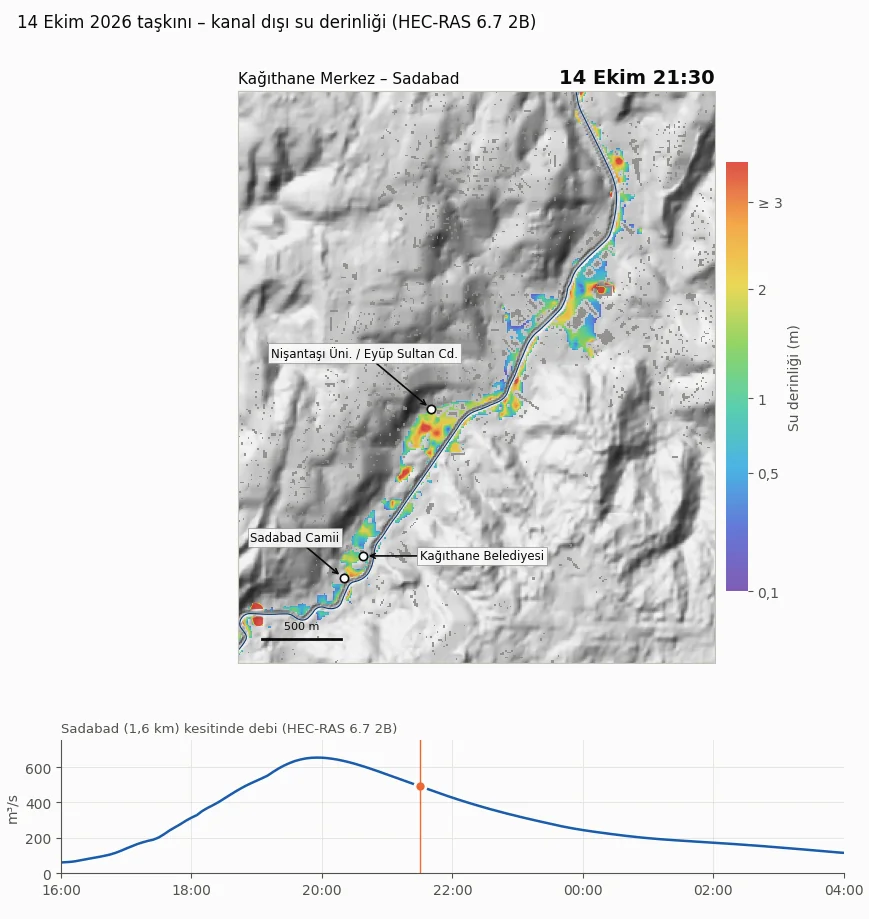
The animation below shows the water depth the model calculates in central Kağıthane from 16:00 on 14 October to 04:00 on 15 October, in ten-minute steps. Two phases stand out: the area around the stream filling with water in the evening, and the water receding after midnight.
What the maps tell us
We compared the model results with what was reported in the press about the event. All five press-reported flooding locations that fall inside the model area appear under water in the model results:
- the area around Kemerburgaz Street in Ayazağa,
- the Vadi İstanbul complex and its surroundings,
- a university campus on Eyüp Sultan Street,
- the square in front of Kağıthane’s municipal building,
- the surroundings of the historic Sadabad Mosque, near the mouth of the stream.
On timing: in the model the stream reaches its peak discharge between 19:25 and 20:10, while the press reported flooding between 20:00 and 21:30. The model’s timing is within half an hour to an hour of the reports, with the model running early. The water depths the model calculates at these locations are, on the other hand, higher than those described in the press; part of that difference may come from elevation error in the terrain data and from the fact that channel depths and bridges have not yet been surveyed. This should be read as a consistency check, not as a validation against measured water levels.
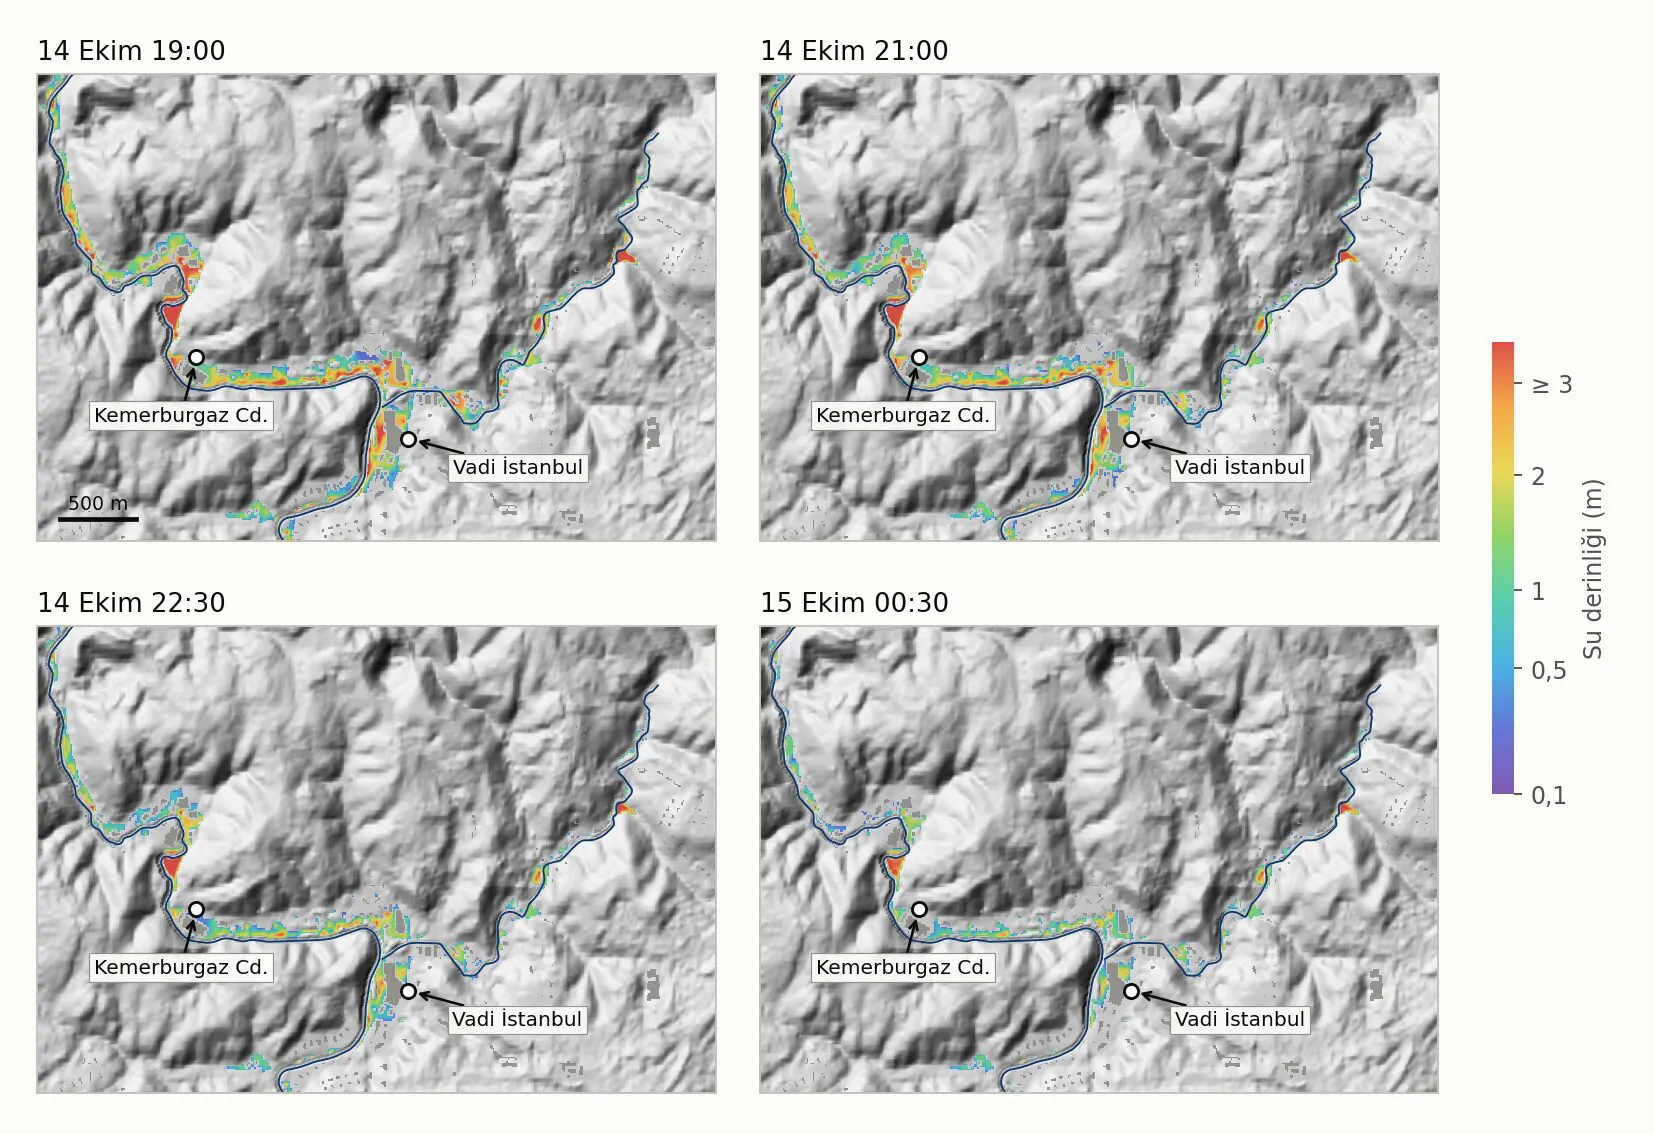
The second thing the maps show is the order in which the water arrived. In the model, water begins to collect in the low-lying ground near the stream from late afternoon; in most of central Kağıthane it reaches a depth of 10 centimetres between 16:00 and 19:00 and peaks at around 20:00.
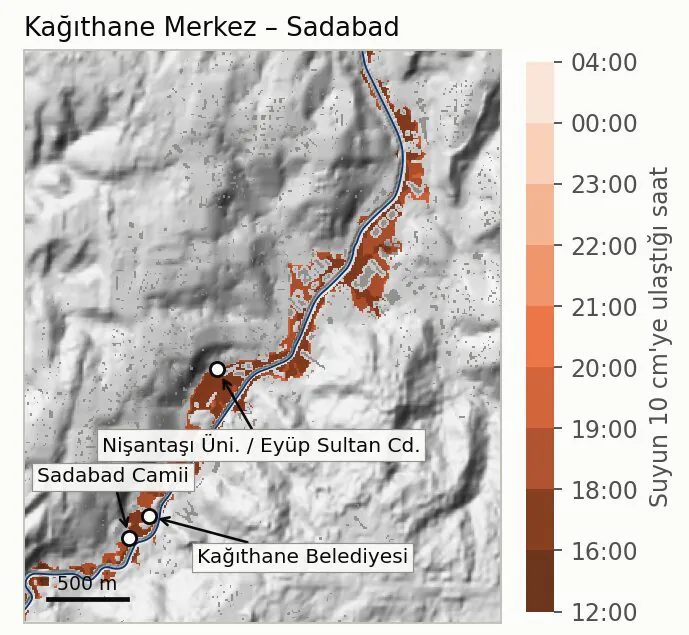
As for the impact: the model estimates that about 164 hectares (1.6 km² or so) outside the stream channel were flooded. Some 315 buildings and some 20 critical facilities, such as schools, health facilities, places of worship and energy installations, are estimated to lie within the flooded area. Press reports describe a wide area of impact stretching from Ayazağa to the Golden Horn; the model results show a similar extent.
How unusual was this flood?
We compared the size of the flood with what engineers call design floods: the scenario floods used as a reference in infrastructure and planning, each tied to a return period such as once in 100 years. The flows for these scenarios were estimated with two separate hydrological methods. The second gives results about 15 to 20 percent lower, so below we present the two together as a range.
On the first method’s design curve, the 14 October flood was of the size expected once in 100 years on average, with a plausible range of 60 to 140 years. The second method, which gives lower design flows, would make the event rarer. Rain and flood do not have to share the same return period: in this event the 24-hour rainfall comes out at once in 135 years and the flood, on the first method, at once in 100 years.
The same model was also run for design floods expected once in 50, 100, 500 and 1,000 years. Because the event itself was computed with the first method, we compare it with that method’s 1-in-100-year flood: the two footprints are almost the same (about 164 ha versus 165 ha). Under the second method the 1-in-100-year flood covers some 135 ha, so by that method the event exceeds it.
| Scenario | Flooded area (ha, approx.) | Buildings in flooded area (approx.) | Critical facilities |
|---|---|---|---|
| 1 in 50 years | 115-145 | 220-280 | 13-18 |
| 1 in 100 years | 135-165 | 260-315 | 17-20 |
| 1 in 500 years | 170-200 | 325-375 | 20-21 |
| 1 in 1,000 years | 185-215 | 340-395 | 21-22 |
| 14 October 2026 event | 164 | 315 | 20 |
Table 2. Model estimates for areas outside the stream channel with water deeper than 10 cm. Ranges span the lower and upper results of the two hydrological methods; the event row was computed with the first method. Model estimate (preliminary study).
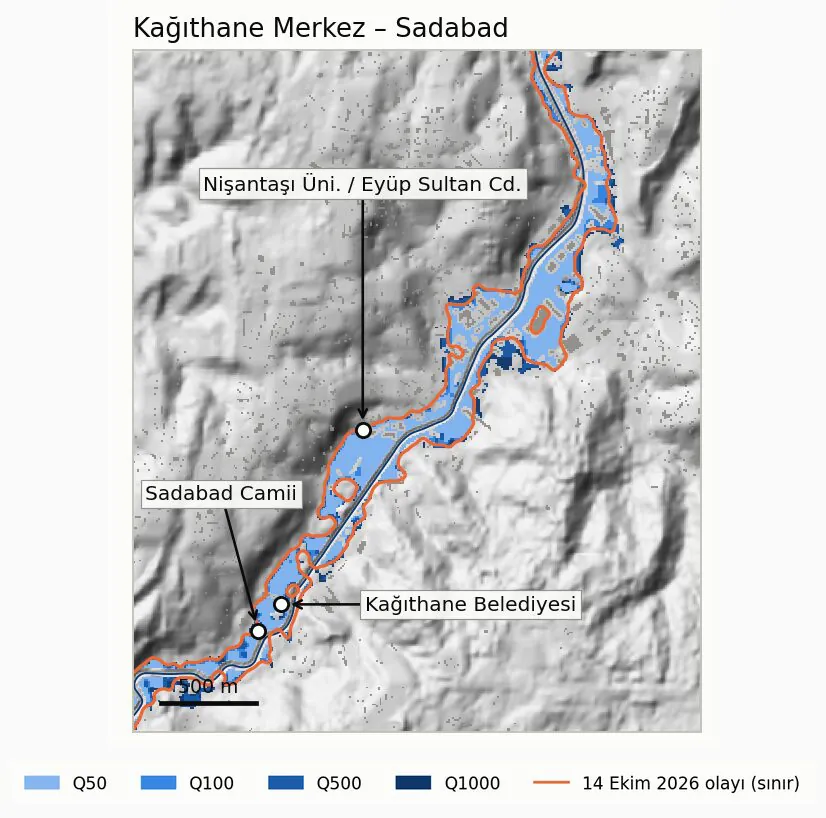
Two things stand out from this comparison. First, on the first method the 1-in-100-year scenario is no longer just a scenario on paper; it is a reference that largely coincides with an event that actually happened. Second, in the rarer scenarios the flooded area does not grow as fast as the flow does: in the model, discharge in the 1-in-1,000-year flood is 70 to 80 percent higher than in the 1-in-100-year flood, while the affected area is 30 to 35 percent larger. Even so, ground just outside the 100-year outline does fall within the flood extent in the rarer scenarios, and a publicly available draft river basin flood management plan uses the 1-in-500-year flood as a benchmark for measures.
Which decisions can the maps support?
For each scenario the maps show where the water goes, how deep it gets and when it arrives. With the preliminary nature of the study kept firmly in mind, here is what that means for different readers:
Municipalities and infrastructure managers. Which streets and squares the water collects in first, which critical facilities fall within the flood extent in which scenario, and how the water recedes as the night goes on: all of this can support the planning of transport routes, assembly points and response priorities.
Insurance and reinsurance. Flooded areas and building counts by return period show which addresses in a portfolio fall within the flood extent in which scenario; maps of this kind are the physical input to annual expected loss and probable maximum loss calculations. For more, see how insurers use climate risk maps and the financial impact of physical climate risk. For a related example of moving from area-wide flood alerts to asset-level exposure, see our note on the Lower Stour in Bournemouth and Christchurch.
Real estate and project development. Whether a plot lies inside the 100-year outline, between the 100-year and 500-year outlines or outside both gives a measurable input to decisions such as land valuation, ground-floor use and where to place technical infrastructure. For plot-level queries, see the UrClimate Score risk maps.
Facility managers. When the water reaches a site is the yardstick for lead time in a business continuity plan. In this event the stream peaked two to three hours after the heaviest rain, but in low-lying spots water began to collect much earlier, so lead time has to be read separately for each site. For the placement of equipment, stock and electrical panels, the depth map is the measure.
The limits of this study
This is a preliminary assessment. The figures should be read with the following limits in mind:
- The terrain was derived from a 30 m open, satellite-derived elevation model; elevations may be off by 2 to 4 metres.
- Channel widths were read from satellite imagery; channel depths have not been surveyed and are assumptions.
- Bridges have not yet been added to the model.
- Discharges were estimated independently; they will be compared with official flow records once those are obtained.
- There is no rain gauge in the northern part of the catchment, so the spatial distribution of rainfall is estimated.
- The model was checked against observations reported in the press rather than measured water levels.
- The main results assume normal antecedent soil moisture. Assuming dry antecedent conditions, consistent with the dry days before the storm, the modelled peak drops to about 514 m³/s; flows, return period and impact figures are sensitive to this choice, and it is one of the main uncertainties that measured data will settle.
- The model covers the main valley; what happened in side streams and in street-level surface runoff is outside the scope of this study.
As these data become available, the next phase aims to update the model with high-resolution terrain data, surveyed channel cross-sections and bridge openings, official flow records, radar rainfall estimates and stream level measurements. Terrain and cross-section surveys would sharpen the depth maps, official flow records the return period comparison, and level measurements the timing. Today’s maps give a first answer to the question “how far did the water reach, and roughly how big was the event”; the question “up to what level” can only be settled by measurement, and that is the answer a design level or an investment decision requires.
Alkazar’s role
Alkazar is an engineering company that has worked in meteorology and climate risk since 2011, with more than 200 projects to date. We carried out this study on our own initiative after the event, using open data sources and weather station records. Our aim is to set out clearly how a flood developed along a stream, and to make that picture more accurate as measured data come in.
The same approach underpins our flood modelling and catchment-scale flood and groundwater risk analysis services; the same method can be repeated with surveyed data for a specific catchment, plot or portfolio. For questions about the method and data, please get in touch through our contact page.
Frequently asked questions
What does “a 1-in-100-year flood” mean? Does it mean there will not be another one for 100 years?
No. A return period describes an average: a flood of this size is expected once in 100 years over the long run, which is about a 1 percent chance in any given year. Two can occur in consecutive years, or none for a long time. For the 14 October flood, this study puts the plausible range at 60 to 140 years on the first method; the second method would make the event rarer.
How well did the model capture what actually happened?
On location, yes: all five press-reported flooding locations inside the model area are under water in the model. On timing, partly: the model places the highest water about half an hour to an hour before the reported time of flooding. On depth, not yet: the depths the model calculates at these locations are higher than those described in the press; the reasons are covered in the next question but one. This is a consistency check, not a validation against measured water levels.
The rain was a 1-in-135-year event but the flood a 1-in-100-year event. Isn’t that a contradiction?
No. The size of a flood depends not only on the total rainfall but on how quickly it fell and on the state of the ground. In this event the rainfall over short durations was at more common levels (once in about 9 years for the wettest hour, once in about 40 years for the wettest three hours). The 100-year figure for the flood is on the first method; both figures will be looked at again when the model is updated with measured data.
The depths on the maps are higher than what I saw. Why?
There are several reasons. The terrain data are of moderate resolution and carry an elevation error of 2 to 4 metres; channel depths and bridges have not yet been surveyed. In the comparison with press-reported locations we also used the highest modelled depth within 50 metres of each point, which widens the gap. The difference will be looked at again when the model is updated with measurements.
Are these official flood maps?
No. This is a preliminary study; the figures are model estimates and will be updated with measured data. They should not be used directly for planning or investment decisions. The maps are best read as a complement to publicly available plans and reports.
What can I do for my own site or portfolio?
A list of addresses or plots can be overlaid on the flooded areas by return period to establish which scenario first puts each address inside the flood extent. A model updated with surveyed data adds water depth and arrival time to that answer.
Method and data note
- Model: a two-dimensional hydraulic model, with a one-dimensional cross-check. The 14 October 2026 event and the 50, 100, 500 and 1,000-year design floods were run with two hydrological methods.
- Rainfall: hourly records from seven weather stations around the catchment; return periods from a published regional rainfall intensity-duration-frequency model for Türkiye.
- Terrain and buildings: a 30 m open, satellite-derived elevation model; building, stream and land-use layers from open map data; channel widths from satellite imagery.
- Impact indicators: areas outside the stream channel with water deeper than 10 cm. Building and facility counts are intersections with the flooded area, not damage assessments.
- All figures are preliminary and will be updated with measured data.
Related content
- Flood modelling
- Flood and groundwater risk analysis at catchment scale
- From flood alerts to asset-level decisions: the Lower Stour, Bournemouth and Christchurch
- Flood risks: types, impacts and data-driven analysis
- How insurers use climate risk maps
- The financial impact of physical climate risk
- Insurance and reinsurance sector
- Meteorology and climate data
- UrClimate Score risk maps