In late January 2026, the UK saw a dense cluster of flood alerts and warnings following prolonged rainfall and saturated ground. Reporting at the time noted 66 flood warnings (flooding expected) and 149 flood alerts (flooding possible) still active across England, alongside ongoing disruption and recovery work.
One of the locations highlighted in public updates was the Lower Stour at Iford Bridge Home Park (Bournemouth)—an area where a severe “danger to life” warning was no longer in place, but water levels remained high and evacuees were advised to follow local response guidance before returning. (https://www.theguardian.com/uk-news/2026/jan/29/flood-alerts-warnings-england-northern-ireland-storm-chandra)
For insurers and asset managers, this is the exact moment a familiar gap appears:
Public warnings answer “Is flooding possible/expected in this area?”
But underwriting, portfolio steering, and loss prevention require “Which exact assets are most exposed—and why?” That’s where coordinate-level climate risk intelligence becomes decision-useful.
What our UrClimate Score flagged at coordinate level
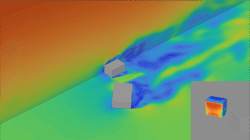
Below is an example coordinate in the same Lower Stour / Iford Bridge corridor –shown in the attached heatmap and point score card.
Point Risk Score (example coordinate):
- Topographic Flood Risk: 77/100
- Meteorologic Flood Risk: 61/100
- Storm Risk: 71/100
- Rainfall Risk: 52/100
(plus multi-peril context such as hail, lightning, etc., which matters for portfolio aggregation.)

The important observation isn’t just “high risk” in general; it’s the spatial structure of risk: the heatmap shows sharp gradients across short distances—exactly what drives the difference between two nearby assets experiencing very different outcomes in the same storm. This is the “blind spot” of broad zoning: flood outcomes are controlled by micro-topography and flow paths, not just the town name or postcode.
UrClimate Score — Decision-Ready Climate Risk Data for Insurers & Asset Managers
UrClimate Score delivers hyper-local climate risk intelligence at coordinate precision, turning raw hazard information into decision-ready risk data that financial teams can use directly.
Unlike broad hazard maps or postcode-level alerts, UrClimate Score provides consistent, comparable scores for each asset location. This supports underwriting, pricing, portfolio screening, accumulation control, and long-term risk monitoring across portfolios. For insurers, UrClimate Score enables:
- differentiation of risk at asset level,
- integration of risk scores into pricing and underwriting workflows,
- identification of structural exposure before events materialize.

For asset and portfolio managers, UrClimate Score enables:
- rapid screening of large portfolios for high-risk exposures,
- detection of risk concentration hot-spots,
- forward-looking risk insight that complements public warnings.
UrClimate Score is part of Alkazar’s climate risk platform. It complements official warning systems by translating complex hazard datasets into financially meaningful risk scores that can be operationalized in decision processes.
Learn more about the product at alkazar.com.tr/products/urclimate-score.