

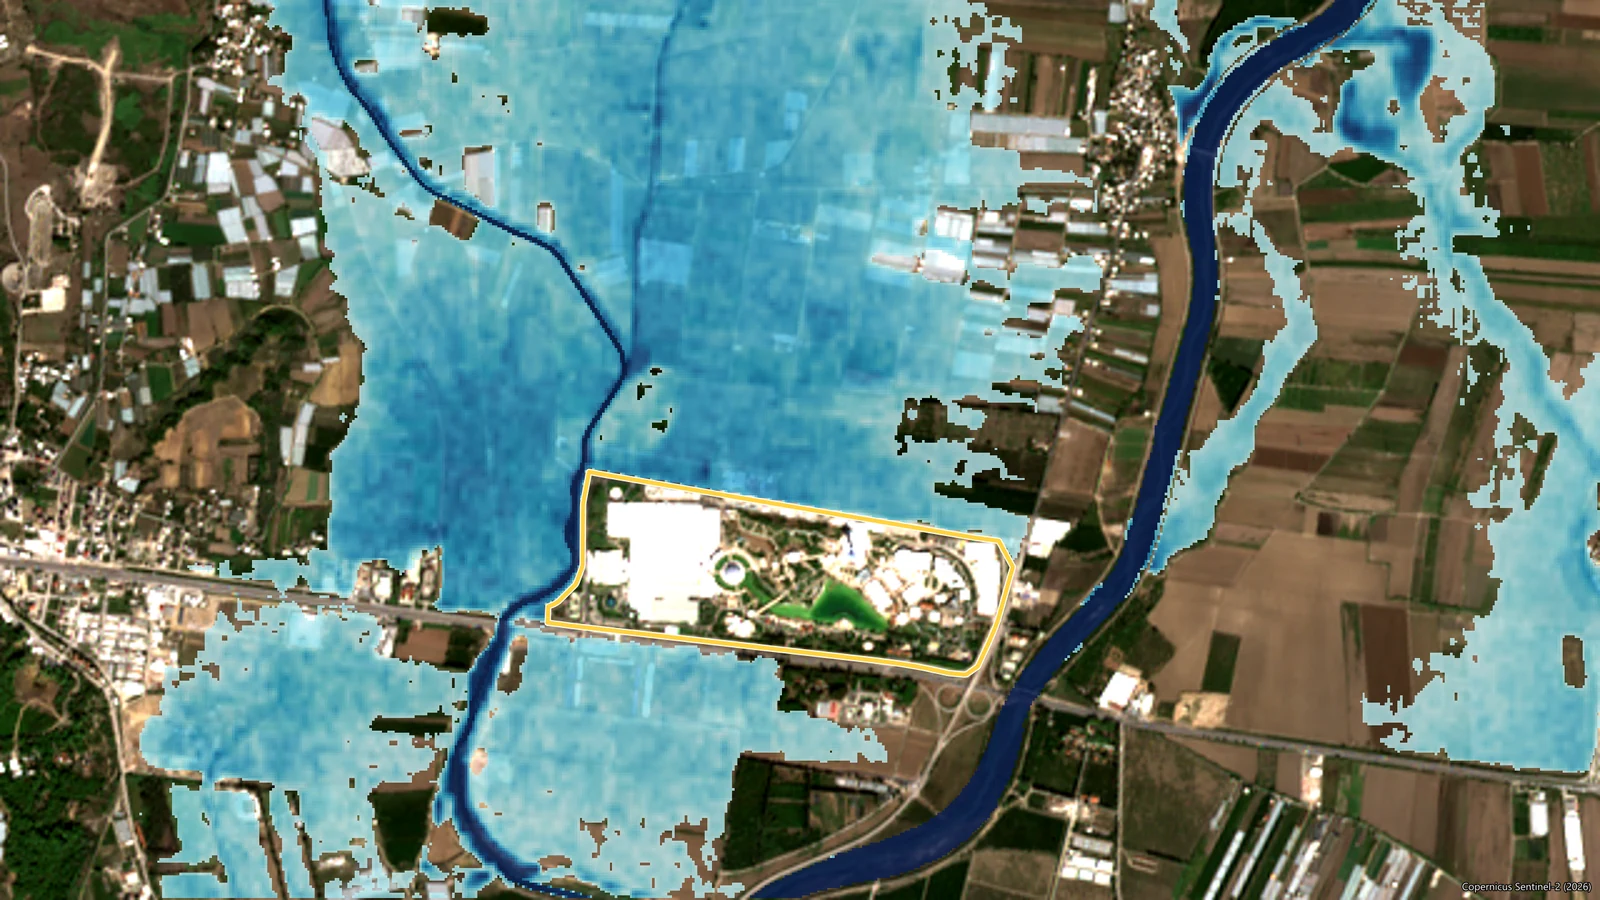
Alkazar · November 2026 · Preliminary study
COP31 meets in Antalya on 9-20 November 2026, on the floodplain of the Aksu River. Could sudden, extreme rain fall during the summit, and if it did, what would happen to the venue and the roads that lead to it? We looked at the historical record, a flood model and the current forecasts together.
The world’s climate agenda meets in Antalya on 9-20 November 2026. COP31 is held at the Antalya EXPO Center in the district of Aksu, on the grounds that hosted Expo 2016 Antalya. The site lies on the flat plain between the Aksu River and the Tehnelli Stream. November is when the Mediterranean turns from a dry summer to a wet winter: some of the year’s heaviest downpours arrive in these weeks.
So we asked three questions. What does the historical record say about these twelve days? If a major flood came, what would happen to the venue and the roads that lead to it? And what do today’s forecasts show for the summit days? We answer each in turn below, then put them together. The aim is not to raise an alarm. It is to show when a hazard becomes a real risk, and how that is measured.
Preliminary study. The flood results in this article come from a model built without a site survey, from open satellite data and public documents. The forecast figures were taken on 6 November 2026, 14:32 (UTC+3) and change with every new model run. This article is not a flood warning, and its figures should not be used directly for planning, evacuation or investment decisions. For current warnings, follow the Turkish State Meteorological Service (MGM) and the disaster agency AFAD.
The short answer
- History: In the 46 years from 1980 to 2025, total rainfall over 9-20 November exceeded 100 mm 5 times. In 19 of those years, at least one of the twelve days brought more than 20 mm.
- Hazard: In our model, as long as the ring levee is continuous, the Expo site stays dry in both the 100-year and the 500-year flood; the highest water outside is 2.1 to 2.3 m below the 12.10 m design crest. Where satellites measure a lower crest, that margin shrinks to between 0.3 and 1.0 m. Some of the roads that serve the site, including a short stretch of the D400 highway, go under water too deep to be safe for vehicles.
- Forecast: In the ensemble forecasts of 6 November 2026, 14:32 (UTC+3), the chance of more than 20 mm in a day at the site peaks at 10% during the first week of the summit. The signal is stronger for the final days (up to 16%), but confidence at that range is low.
- Reading: In the forecasts, signs of heavy rain in the first week of the summit are weak; there is a signal for the final days, but it is uncertain. Whatever the forecast, what persists is exposure: the plain around the site, and access.
- Limits: Local rainfall drainage was not modelled, and the continuity of the ring levee has not been verified on the ground.
Why ask the question?
Hazard and risk are not the same thing. A hazard is an event that is physically possible: this much rain, water this deep. Risk begins where that event touches people, assets and operations. The same downpour is a puddle in an empty field; on a day when tens of thousands of people use the same road at the same hour, it is something else entirely. According to the summit’s official website, about 100,000 participants are expected at COP31.
COP31 is a good place to see the difference. On the official flood risk map, the plain around the Expo site falls within the Aksu’s 100-year potential flood area. The site itself was designed to be protected by a perimeter levee recommended by DSİ, the State Hydraulic Works. The hazard is documented, and a defence is in place. That leaves three questions: is the defence enough, what does it not cover, and what is the weather showing this year, on these days?
One note on terms: a flash flood and a river flood are different events. In a flash flood, short and intense rain fills roads, underpasses and low points within minutes or a few hours. In a river flood, rain spread across a catchment swells the river hours later. Both have the same trigger: rainfall. The model in this article deals with the river flood; the forecast section deals with the trigger of both. For background, see Flood risks: types, impacts and data-driven analysis.
This article builds on our earlier COP31 Antalya weather and climate risk analysis. That page compared every period of the year; here we zoom in on the summit days, the venue and the roads. The figures in the two studies are not identical: here we used daily totals for the grid cell that contains the Expo site.
What does history say?
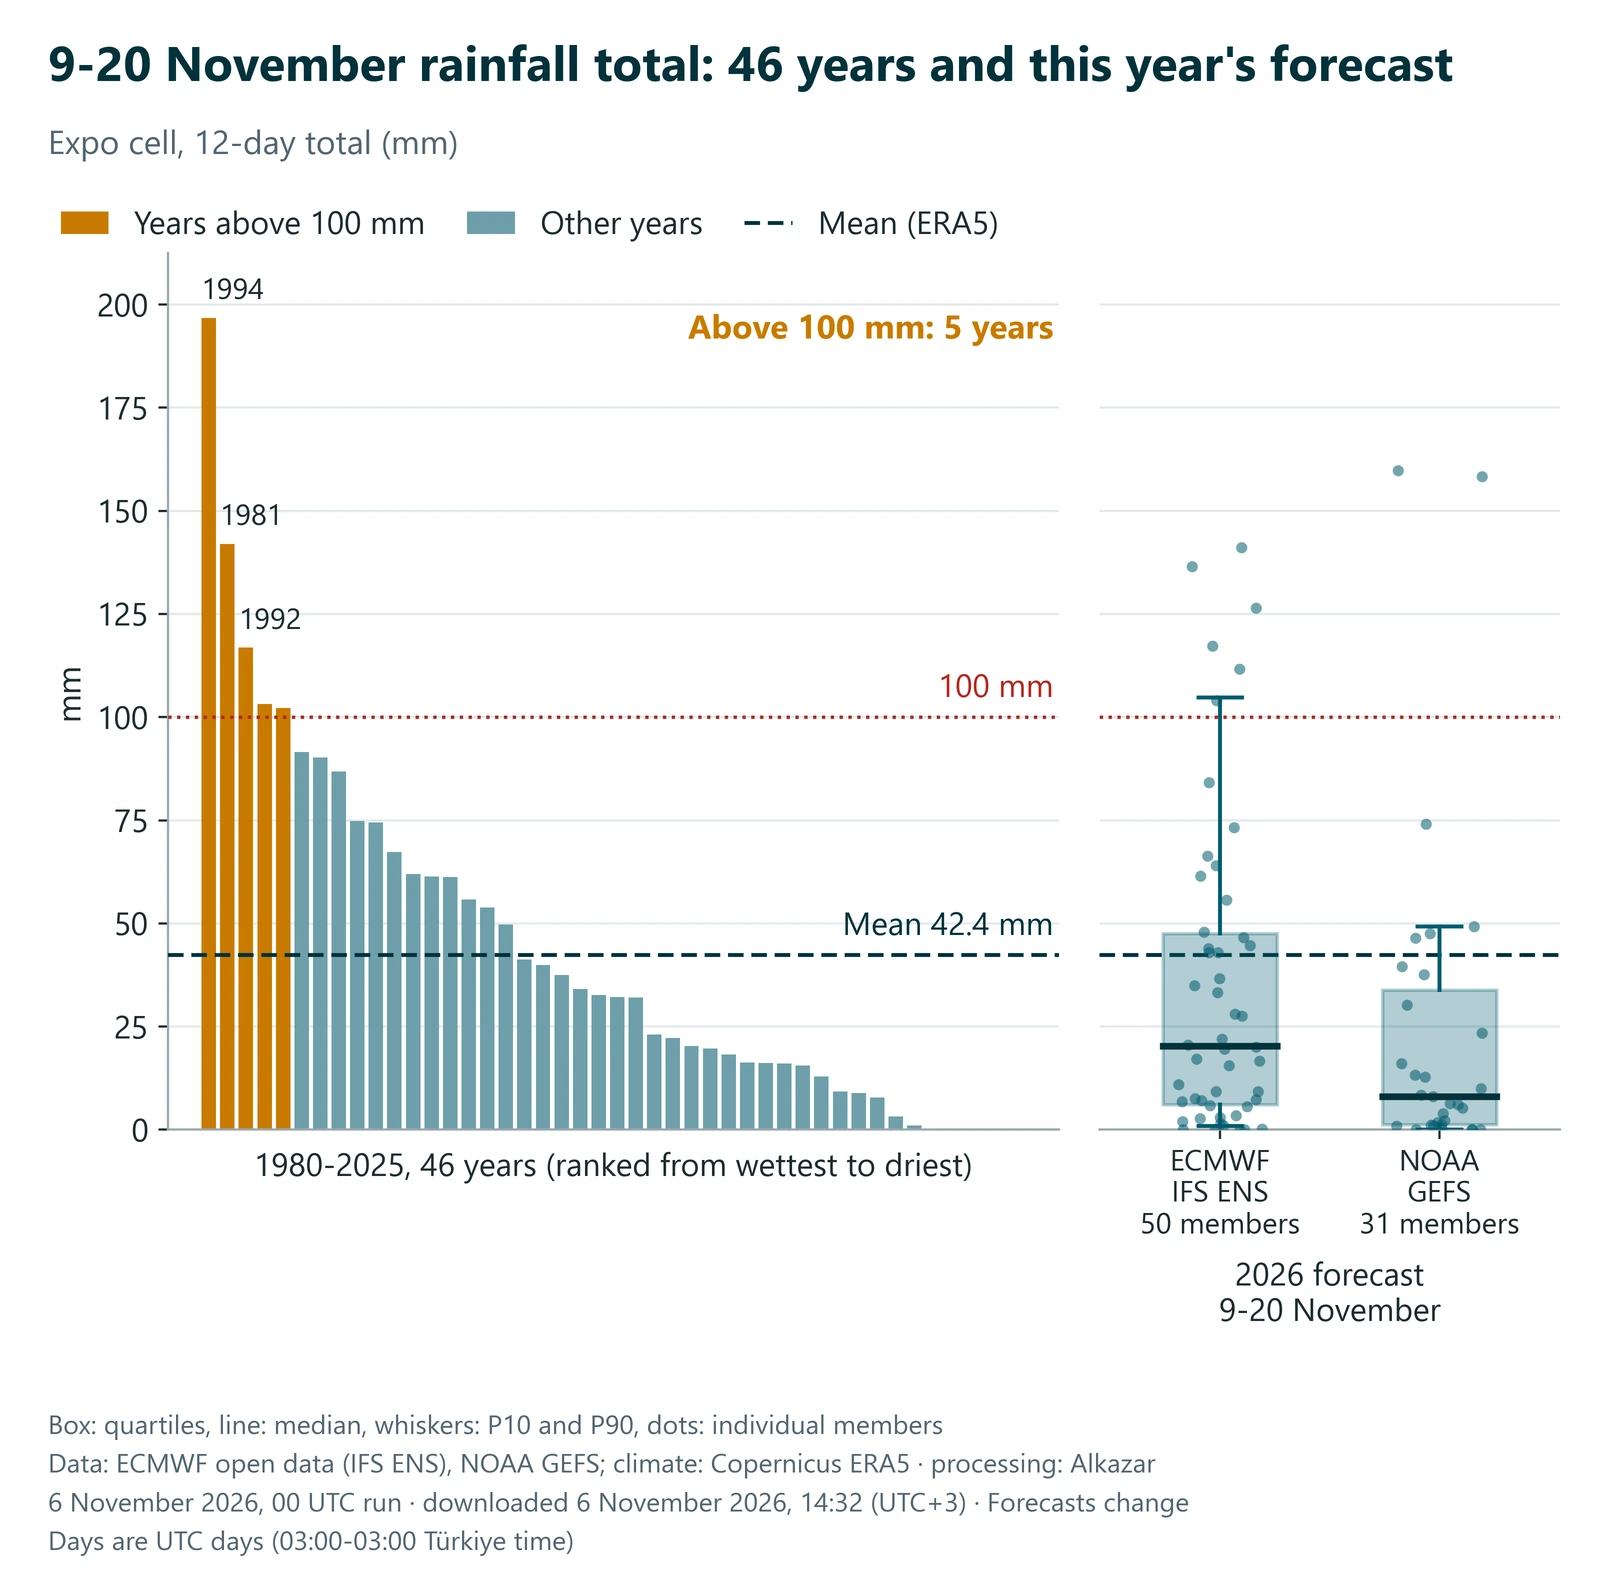
The first layer is likelihood: how have these twelve days gone in the past? From Copernicus’s ERA5 reanalysis we took daily rainfall totals for 1980-2025 in the grid cell that contains the Expo site.
- Total rainfall over 9-20 November averages 42.4 mm, with a median of 32.1 mm. The gap between the two shows a skewed distribution: most years are quiet, a few are very wet.
- The period total exceeded 100 mm 5 times in 46 years. The threshold of the wettest 10 per cent is 96.9 mm.
- In 19 of those years at least one day brought more than 20 mm, and in 6 at least one day brought more than 50 mm. The wettest single day in this dataset, 82.8 mm, fell in 1981.
- The second half of the period is wetter than the first: 9-14 November averages 16.0 mm, and 15-20 November 26.4 mm.
One limit matters when reading these numbers. Reanalysis data are averages over grid cells tens of kilometres wide, so they understate a downpour that falls on one district in a few hours. Station measurements make the gap plain:
- According to the Turkish State Meteorological Service’s 1991-2020 normals, Antalya receives about 152 mm of rain in November, with rain on roughly 8 to 9 days.
- According to the same service, Türkiye’s highest rainfall totals for 4- to 12-hour durations were recorded in Antalya on 4 November 1995, including 428 mm in 12 hours.
- On 28 November 2021, Aksu received 168.8 mm of rain in 24 hours, and farmland in Aksu and Serik was flooded.
- On 24 January 2026, Aksu recorded Türkiye’s highest 24-hour rainfall that day, 190 mm, and floods damaged greenhouses and farmland in the district.
So the cell average answers “how often is this period wet” well, and “how much can fall on one spot in a few hours” poorly. For this region, the answer to the second question is: a great deal.
The plain’s own history points the same way. In February 2010 the Aksu and its tributaries overflowed, flooding farmland and some homes around Solak, Boztepe and Kundu. In October 2011 floodwater from the Aksu’s tributaries inundated the Aksu plain; according to the then Ministry of Forestry and Water Affairs, DSİ’s river works kept the Antalya-Alanya highway open to traffic.
If a major flood came: a dry site, severed roads
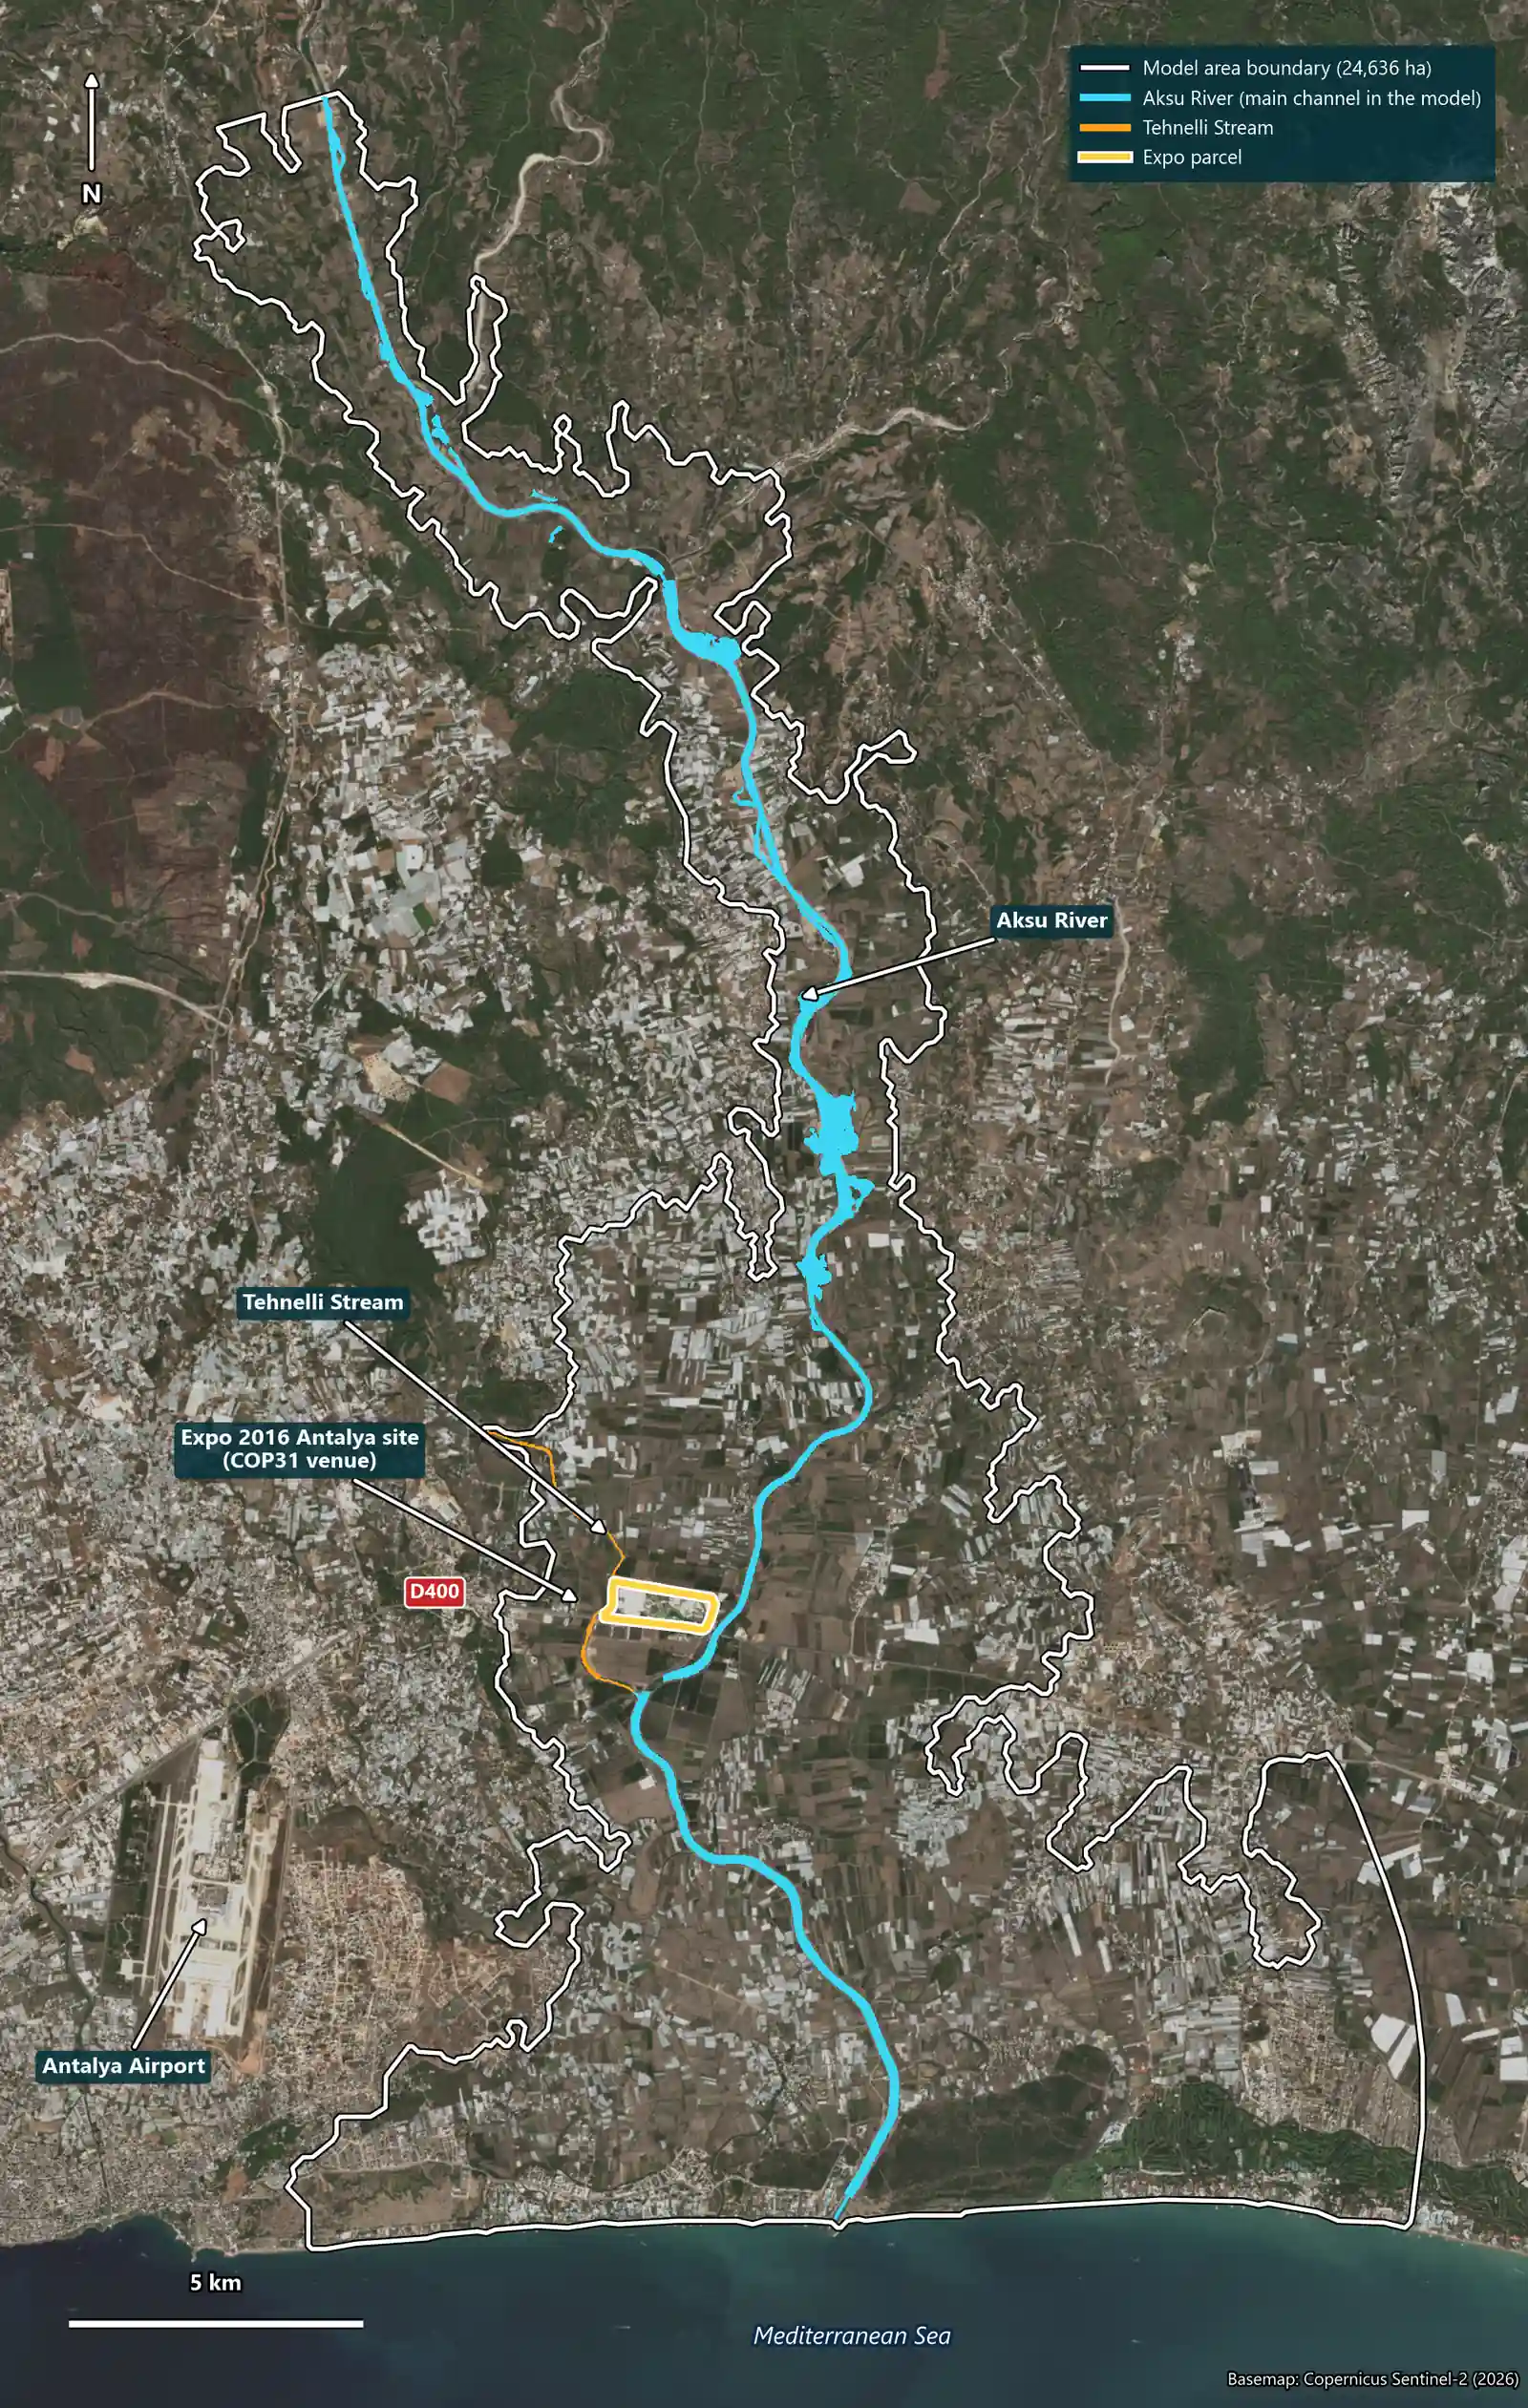
The second layer is consequence: we set likelihood aside and ask “what if”. Our hydrology team modelled the Expo site and its surroundings under the floods expected, on average, once in 100 years and once in 500 years on the Aksu River and the Tehnelli Stream.
Following the documents
- The site’s position on the Aksu floodplain was known to the authorities. According to the project documents, the Expo site was enclosed by a perimeter levee with a crest at 12.10 m, as recommended by DSİ.
- In the early 2010s DSİ tendered a flood protection project for the lower Aksu.
- Antalya’s 2022 Provincial Disaster Risk Reduction Plan (AFAD, in Turkish), citing DSİ data from 2021, gives the Aksu’s 100-year flood discharge as 1,764 m³/s and its 500-year discharge as 2,316 m³/s, with potential flood areas of 13,764 and 14,630 hectares. On the flood risk map in the plan (Figure 2.8), the plain around the Expo site falls within the 100-year potential flood area.
The documents say two things at once: the site is on a floodplain, and a levee was planned to protect it. We put that levee into a model and tested the present situation.
How we modelled it
- Terrain: We resampled the 30 m Copernicus elevation model to a 10 m grid, and set the levee and channel elevations from laser measurements by NASA’s ICESat-2 and GEDI satellites.
- Discharges: For the Aksu we used the official values (1,764 m³/s for the 100-year flood and 2,316 m³/s for the 500-year flood). No official value exists for the Tehnelli, so we scaled a rainfall-based estimate against the official Aksu values (428 and 580 m³/s). We assumed the two peaks arrive at the same time, which is a cautious assumption.
- Hydraulic model: With HEC-RAS we built a two-dimensional model of about 24,600 hectares and 207,000 cells, and ran a 48-hour flood.
The result: the site stays dry in the model
As long as the ring is continuous, the model shows no flooded area on the Expo parcel in either flood. Outside the ring levee the water rises to at most 9.78 m (100-year) and 10.00 m (500-year); the crest of the ring is at 12.10 m.
| Indicator | 100-year flood | 500-year flood |
|---|---|---|
| Peak discharge, Aksu / Tehnelli | 1,764 / 428 m³/s | 2,316 / 580 m³/s |
| Flooded area in the model domain | 5,219 ha | 7,628 ha |
| Flooded area on the Expo parcel | 0 ha | 0 ha |
| Highest water level outside the levee | 9.78 m | 10.00 m |
| Freeboard to the crest | 2.32 m | 2.10 m |
| Roads unsafe for vehicles (within 4 km of the site) | 37.9 km | 49.6 km |
| D400: stretch unsafe for small cars / greatest depth | 0.28 km / 1.07 m | 0.44 km / 1.23 m |
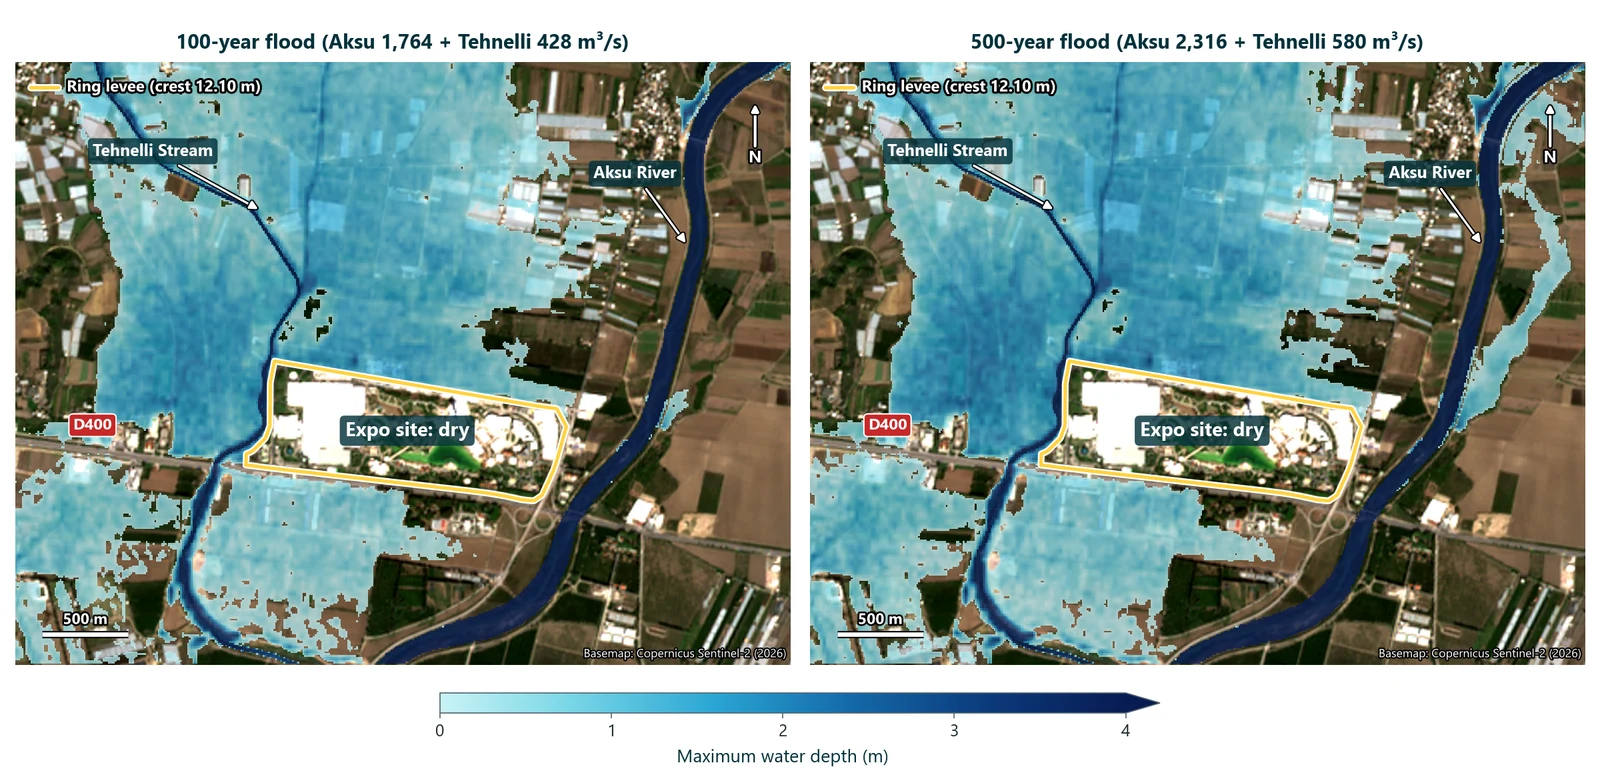
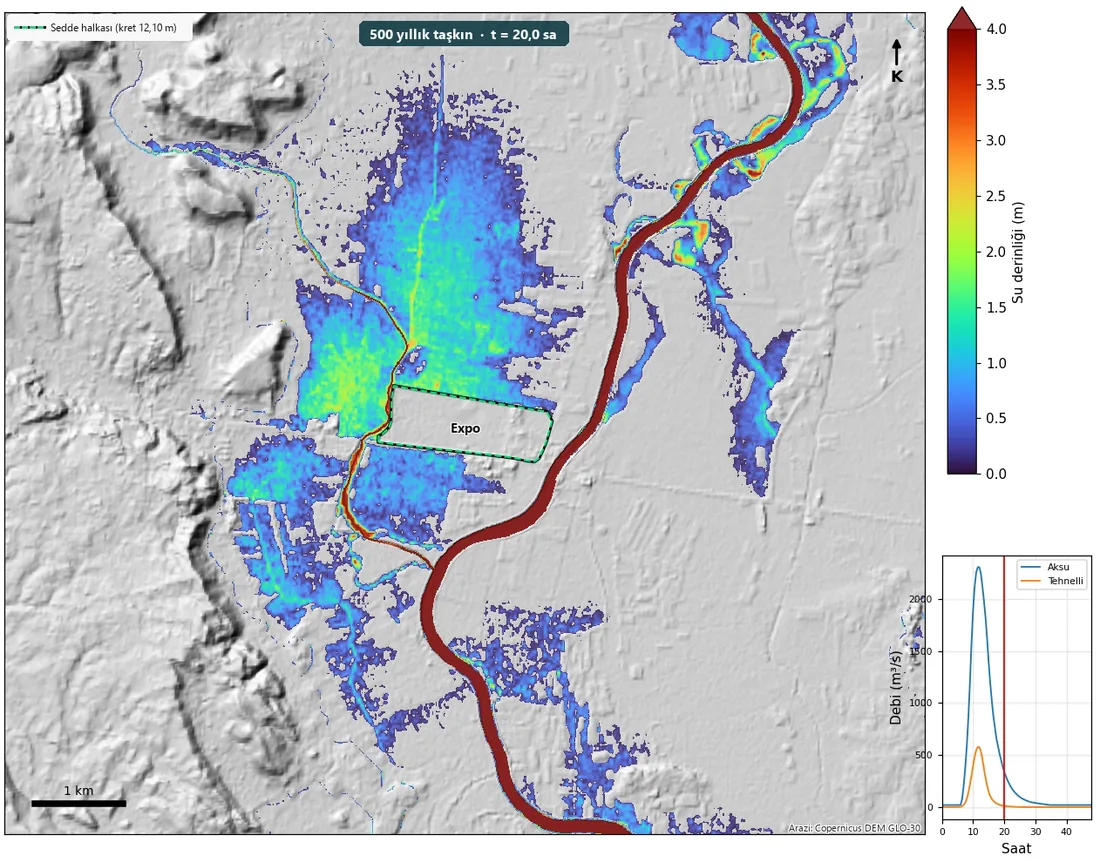
In the model, the water that gathers around the site comes not from the large river but from the small Tehnelli Stream to the west. The Aksu’s water largely stays between its levees, which we measured by satellite at a median of 2.5 m above the surrounding ground. For the Tehnelli we found no levee project in the documents we reviewed; the water that spills spreads across the flat plain and rests against the northern and western sides of the ring.
This result has one condition: the ring must be continuous. Satellite measurements put most of the crest between 11.5 and 12.2 m; along part of it they read 10.3 to 11 m, where the freeboard shrinks to between 0.3 and 1.0 m. There is no satellite measurement along roughly 500 metres of the north-western side or at the entrance gates, and a crossing below crest level could change the outcome. A few GNSS readings on site, or the as-built drawings, would settle this quickly.
In the news sources we searched, we found no report of the Expo site flooding since 2016.
A dry site is not an accessible site
The site is protected; its surroundings are not. In the model, when the plain fills, 1 to 2 m of water stands on the roads north and west of the site. Of the 434 km of roads we examined within 4 km of the site, 38 km in the 100-year flood and 50 km in the 500-year flood reach depths that are unsafe for vehicles. A short stretch of the D400 highway (the Antalya-Alanya road), the main access route to the site, also reaches depths unsafe for small cars along the site’s southern edge and near the Tehnelli crossing, with a greatest depth of more than 1 m. The car parks inside the ring stay dry; of two small car parks outside it, one is partly flooded and the other fully.
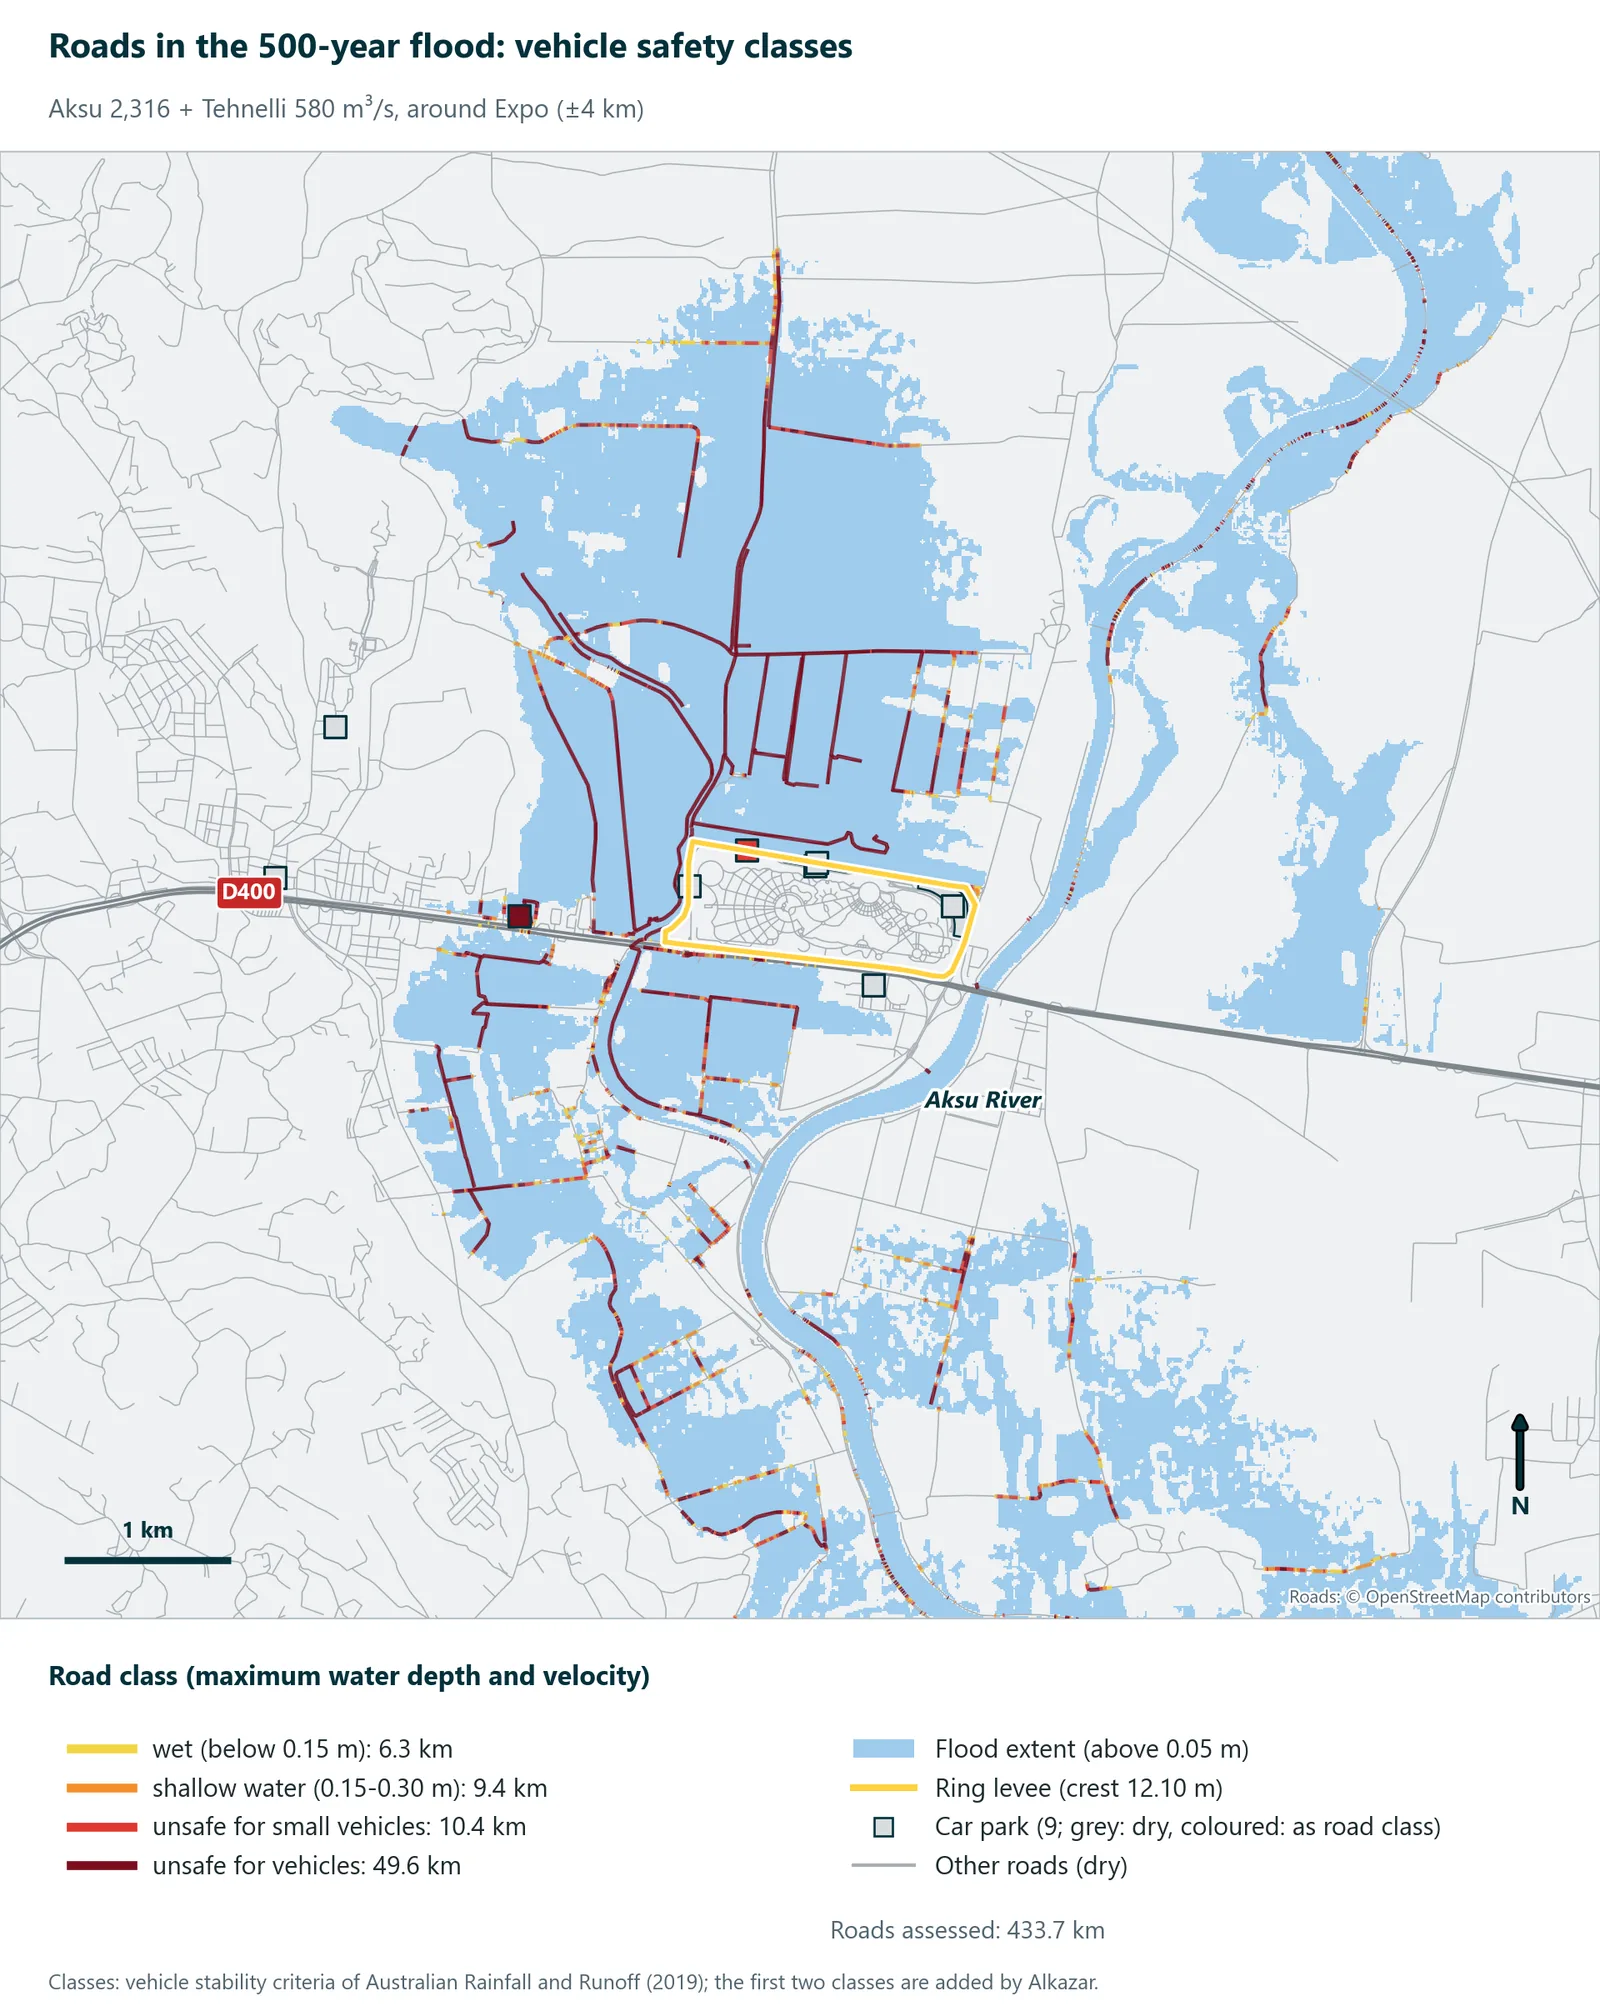
We read these figures as an upper bound: the 30 m elevation model flattens road embankments, and culverts and small bridges are not in the model. The message is still clear: a flood plan has to cover access and evacuation routes, not just the site.
We classified roads using the vehicle stability criteria of Australian Rainfall and Runoff (2019), Australia’s flood guideline: water deeper than 0.3 m, or with a depth-velocity product above 0.3 m²/s, is unsafe for small cars; above 0.5 m or 0.6 m²/s it is unsafe for vehicles, including large 4WDs.
The days ahead: what does the forecast show?
The third layer is today. History says “it can happen”, the model says “this is what would happen”; so what is the atmosphere showing this year, on these days?
For this we looked not at a single forecast but at ensembles. In an ensemble forecast the same model is run dozens of times from slightly different starting conditions; the share of members that predict an event gives an estimate of its likelihood. We processed the open data of two centres in our own pipeline: 50 members from the ensemble of the European Centre for Medium-Range Weather Forecasts (ECMWF) and 31 members from the GEFS ensemble of the United States, 81 members in all. Days are UTC days (03:00-03:00 Türkiye time).
We chose 20 and 50 mm as thresholds. In its daily rainfall forecasts, the Turkish State Meteorological Service uses 21-50 mm as the “heavy” rainfall band; 20 mm marks the start of that band.
As of 6 November 2026, 14:32 (UTC+3) (6 November 2026, 00 UTC run), the picture is as follows:
- First week (9-15 November): Most members show a dry or lightly wet week at the site. On 10 November ECMWF, and on 12 November GEFS, put the chance of a wet day at around 30%, but the chance of heavy rain is low: the chance of more than 20 mm in a day peaks at 10% (12 November, GEFS); for more than 50 mm it peaks at 3%.
- The tail: A low probability is not zero. Individual members show up to 101.6 mm in a day (19 November, ECMWF).
- Final days (16-20 November): The signal grows; the highest daily chance of more than 20 mm is 16% (20 November, ECMWF). These days sit at the edge of the forecast range, so confidence is low.
- Period total: In the ECMWF ensemble the median total for 9-20 November is 20.3 mm, and the threshold of the wettest 10 per cent is 104.8 mm. The 46-year median for the same period is 32.1 mm, with a 10 per cent threshold of 96.9 mm.
- Catchment: Averaged over the box that covers the lower Aksu catchment, the daily chance of more than 20 mm peaks at 18% (20 November).
For comparison: over these twelve days the 46-year climatological chance of more than 20 mm in a day averages 5.6%. The dashed line in the chart below shows that climatological chance day by day.
The table below shows the ECMWF ensemble (50 members); GEFS values are in the chart.
| Day | Chance of a wet day (1 mm or more) | Above 20 mm | Above 50 mm | Median (mm) | Wettest member (mm) |
|---|---|---|---|---|---|
| Fri 6 Nov | 8% | 0% | 0% | 0.1 | 1.5 |
| Sat 7 Nov | 0% | 0% | 0% | 0.0 | 0.1 |
| Sun 8 Nov | 0% | 0% | 0% | 0.0 | 0.2 |
| Mon 9 Nov | 0% | 0% | 0% | 0.0 | 0.1 |
| Tue 10 Nov | 28% | 2% | 0% | 0.0 | 21.2 |
| Wed 11 Nov | 4% | 0% | 0% | 0.0 | 13.1 |
| Thu 12 Nov | 14% | 4% | 2% | 0.0 | 54.7 |
| Fri 13 Nov | 20% | 2% | 0% | 0.0 | 45.7 |
| Sat 14 Nov | 8% | 0% | 0% | 0.0 | 18.3 |
| Sun 15 Nov | 8% | 0% | 0% | 0.0 | 19.0 |
| Mon 16 Nov | 18% | 8% | 0% | 0.0 | 37.8 |
| Tue 17 Nov | 30% | 6% | 0% | 0.0 | 38.1 |
| Wed 18 Nov | 26% | 4% | 0% | 0.0 | 41.0 |
| Thu 19 Nov | 34% | 8% | 4% | 0.0 | 101.6 |
| Fri 20 Nov | 44% | 16% | 8% | 0.0 | 96.2 |
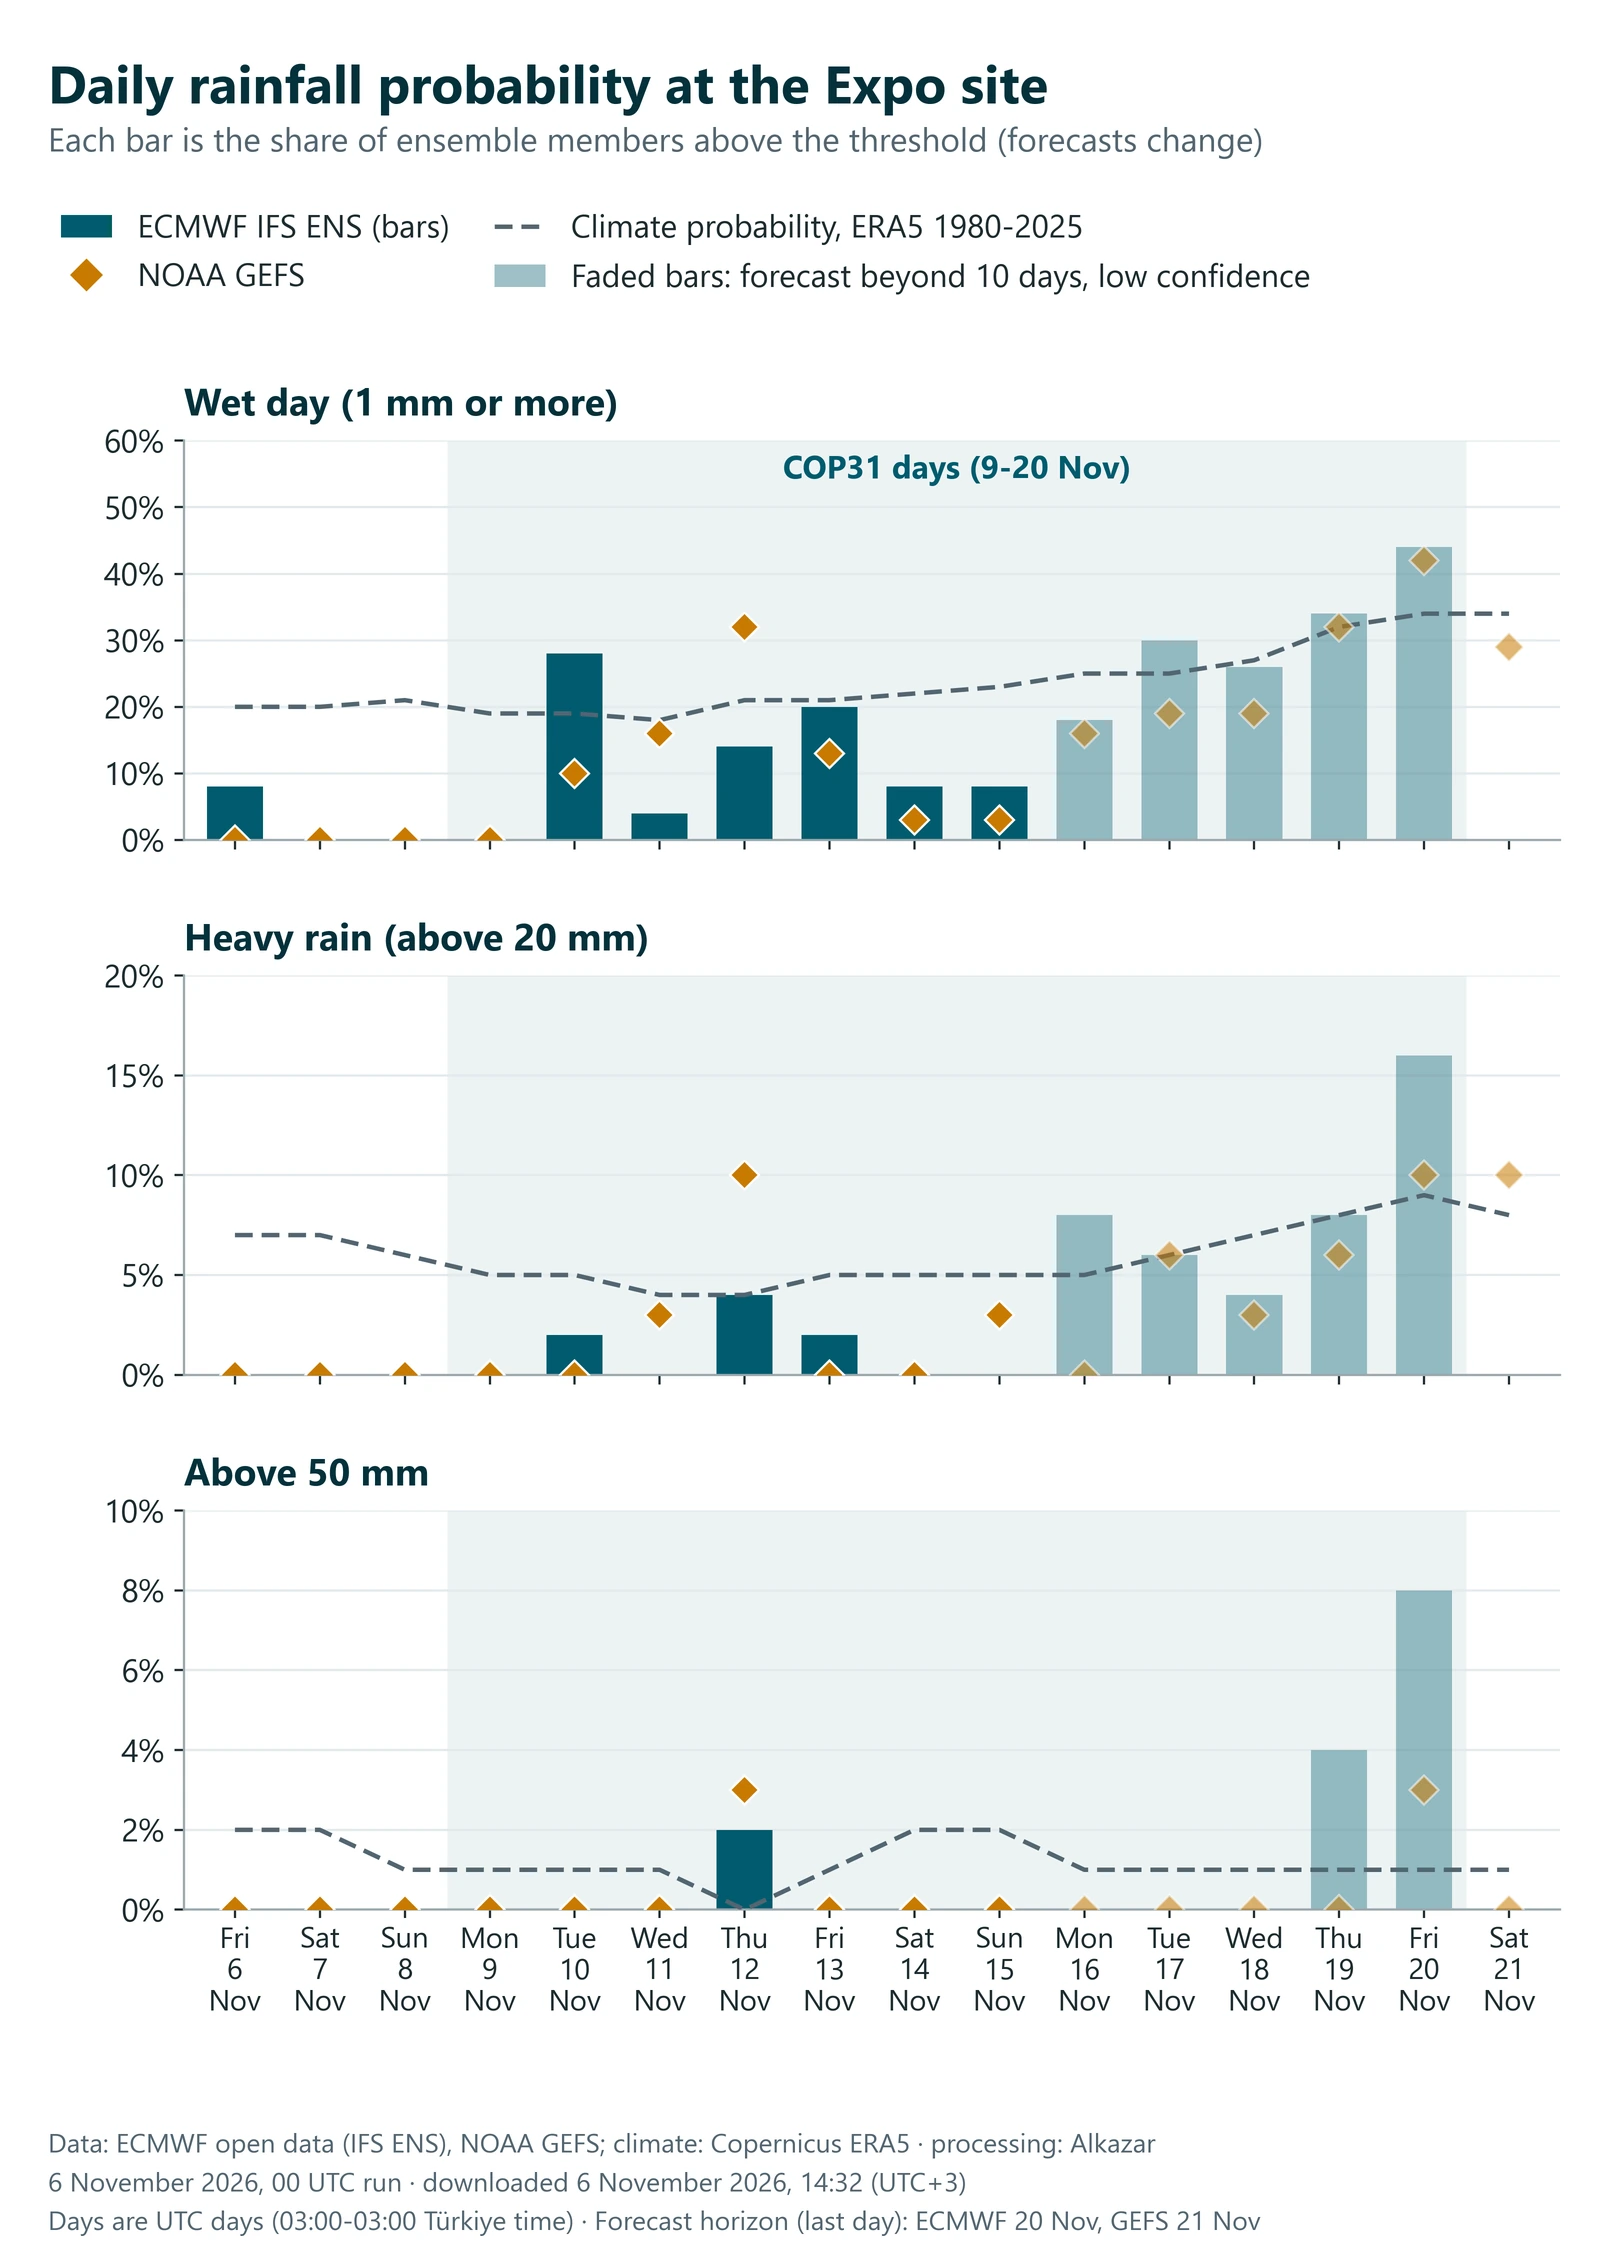
Three things matter when reading this. First, these models work on grid cells tens of kilometres wide; they do not show where a single storm cell will land, only whether the large-scale pattern favours heavy rain. As the station measurements above show, local totals can far exceed a cell average. Second, as the World Meteorological Organization’s guidance notes, the atmosphere is chaotic, so even the best models can go wrong several days ahead, and skill declines as lead time grows. Third, forecasts are renewed every day: the figures in this section hold only for the date given above. Official weather and flood warnings come only from the competent authorities.
When does a hazard become a risk?
Put the three layers together. History says these twelve days are quiet in most years and wet enough to pass 100 mm 5 times in 46 years, and that the region can receive very large totals in a few hours. The model shows that, as long as the ring is continuous, the site stays dry in the 100-year and 500-year floods, while the roads go under water. The forecast shows weak signs of heavy rain for the first week of the summit this year, and an uncertain signal for the final days.
Forecasts change every day. Risk is more than today’s forecast; what persists is exposure:
- Access. The site is about 15 km by road from Antalya Airport and is reached via the D400. In the model the water reaches a stretch of that road just south of the site. For an event, a site that is dry but cannot be reached is still a loss.
- Outside the ring. Car parks, temporary structures and service areas outside the ring do not benefit from the protection.
- Inside the ring. A closed ring keeps out the water outside and keeps in the rain that falls inside. Draining the interior in an intense downpour is a separate matter, and outside the scope of this study.
- Time. A river flood builds over hours, not minutes. In the model, the time of concentration we used for the Aksu’s intermediate catchment, from the dam to the sea, is about 9 hours; for the small Tehnelli it is shorter. That can be a window for warning and traffic management. In a flash flood the window is far shorter.
Seen through an insurer’s eyes, the same picture becomes three questions: how often (history and return periods), how severe (depth and velocity maps), and how far ahead it can be known (the forecast). Pricing cover such as event cancellation, business interruption or vehicle damage, and deciding where to set the trigger in a parametric policy, rest on those three answers. For more, see how insurers use climate risk maps and the financial impact of physical climate risk.
How we do this, and why
Every layer in this article was produced from public data with a repeatable method:
- Open data: satellite elevation and laser measurements, land cover, the road network, official discharges, reanalysis data.
- Physics-based modelling: a two-dimensional hydraulic model that computes how water spreads over the terrain.
- Probabilistic forecasting: the ensemble forecasts of two centres, downloaded from the primary source and processed in our own pipeline.
- Translation into decisions: from a depth map to vehicle safety, and from there to business continuity and financial impact.
Why do it? Because the decision-maker’s question is rarely “will it flood”. It is “if it does, what do I lose, how much, and when will I know”. An event organiser sets the transport plan by that answer; a facility manager the preparation time; an insurer the price and the trigger; a bank the value of its collateral. Carrying physical climate risk from the map to the balance sheet is the core of what Alkazar has done since 2011.
The same approach underlies our flood modelling and meteorology and climate data services, and, for parcel-level queries, the UrClimate Score risk maps.
The limits of this study
- No site survey was carried out. The terrain comes from an open 30 m elevation model, and the levee and channel elevations from satellite laser measurements.
- The result assumes that the ring levee is continuous. About 500 metres of the north-western side and the entrance gates could not be verified by satellite.
- Surface runoff from local rainfall and stormwater drainage were not modelled. The street-scale effect of a flash flood is not in these maps.
- There is no official design discharge for the Tehnelli Stream; it was calculated, and it directly affects the water level west of the site.
- The elevation model predates the construction of the Expo. Car parks and structures added around the site since then are not in the model.
- The official flood risk map was prepared at provincial scale and does not show levees separately. Its potential flood area (13,764 and 14,630 ha) is therefore larger than the one in our model (5,219 and 7,628 ha), and the two studies cannot be compared directly.
- The first two road classes (wet and shallow water) are not part of the guideline; we added them to make the map easier to read. The criteria are based on the stability of a stationary vehicle.
- Forecasts are probabilities; global models working on grid cells tens of kilometres wide cannot resolve individual downpours.
Meet us at COP31
We will present this work and the method behind it in two places during the summit:
- COP31 Insurance House, Belek, 11 November 2026, 13:30-14:30. Our founder, Güven Fidan, is among the speakers on the panel “Sensing Risk: From Mitigation to Early Detection and Resilience” at the COP31 Global Insurance and Resilience Summit, hosted by the Insurance Association of Türkiye.
- COP31 Green Zone. At our stand we can go through the UrClimate products and the maps in this article together. The Green Zone is closed to visitors on 11 and 12 November for the Leaders’ Summit.
Frequently asked questions
Is a flood expected in Antalya during COP31?
According to the ensemble forecasts of 6 November 2026, 14:32 (UTC+3), the chance of heavy rain at the site during the first week of the summit is low: the daily chance of more than 20 mm peaks at 10%. The signal is stronger for the final days, but forecast reliability at that range is low. Forecasts change every day; for current warnings, follow the Turkish State Meteorological Service.
Is the Expo site in a flood zone?
On the official flood risk map, the plain around the site falls within the probable 100-year flood area of the Aksu River. According to the project documents, the site is enclosed by a ring levee with its crest at 12.10 m. In our model, with the ring assumed continuous, the site stays dry in the 100-year and 500-year floods.
What does “100-year flood” mean?
A return period describes an average: a flood of this size is expected about once in 100 years over the long run, which means roughly a 1 per cent chance in any year. The chance of it coinciding with a twelve-day event is lower still. Such events are planned for all the same, because their consequences are large.
What is an ensemble forecast?
The same weather model is run dozens of times from slightly different starting conditions. If most members agree, confidence is high; if they diverge, uncertainty is large. The percentages in this article are the share of members that exceed a threshold.
Is this an official flood map?
No. It is a preliminary study, built from open data without a site survey. It should not be used directly for planning, evacuation or investment decisions. The maps are best read as a complement to public plans and reports.
Can the same analysis be done for another site or event?
Yes. The same method can be repeated with surveyed data for a specific site, facility, event or portfolio. The more measurement there is, the more reliable the maps become.
Sources and data
- AFAD, Antalya Provincial Disaster Risk Reduction Plan (2022): 100-year and 500-year discharges of the Aksu and the flood risk map (DSİ, 2021).
- Expo 2016 Antalya project documents.
- Turkish State Meteorological Service (MGM): Antalya 1991-2020 normals; maximum rainfall for standard durations. Press reports for event measurements (28 November 2021, 24 January 2026).
- Terrain: Copernicus DEM GLO-30 (produced using Copernicus WorldDEM-30 © DLR e.V. 2010-2014 and © Airbus Defence and Space GmbH 2014-2018 provided under COPERNICUS by the European Union and ESA; all rights reserved. The organisations in charge of the Copernicus programme by law or by delegation do not incur any liability for any use of the Copernicus WorldDEM-30). NASA ICESat-2 and GEDI.
- Land cover: © ESA WorldCover project 2021 / Contains modified Copernicus Sentinel data (2021) processed by ESA WorldCover consortium.
- Roads: © OpenStreetMap contributors (ODbL, openstreetmap.org/copyright).
- Satellite imagery: Contains modified Copernicus Sentinel data 2026.
- Climate: ERA5 reanalysis. Contains modified Copernicus Climate Change Service information 2026.
- Forecast: ECMWF open data (IFS ENS), © 2026 ECMWF, CC BY 4.0; NOAA NCEP GEFS.
- Ball, J. et al. (2019), Australian Rainfall and Runoff: A Guide to Flood Estimation, Book 6, Chapter 7; US Army Corps of Engineers, HEC-RAS; World Meteorological Organization, WMO-No. 1091.