We mentioned that more than one design scenario is set up in architectural design approaches. We discussed the daylighting, one of these scenarios, in our previous article (You can find it here). In this article, we evaluate the placement angle of the shading devices for the heating and cooling load performance.
The open office model in Istanbul for this study is below (Figure 1). This open office is a single zone and only has a window on its south-facing facade. Glazing ratio: 0.46 was determined for the south facing facade of this open office.
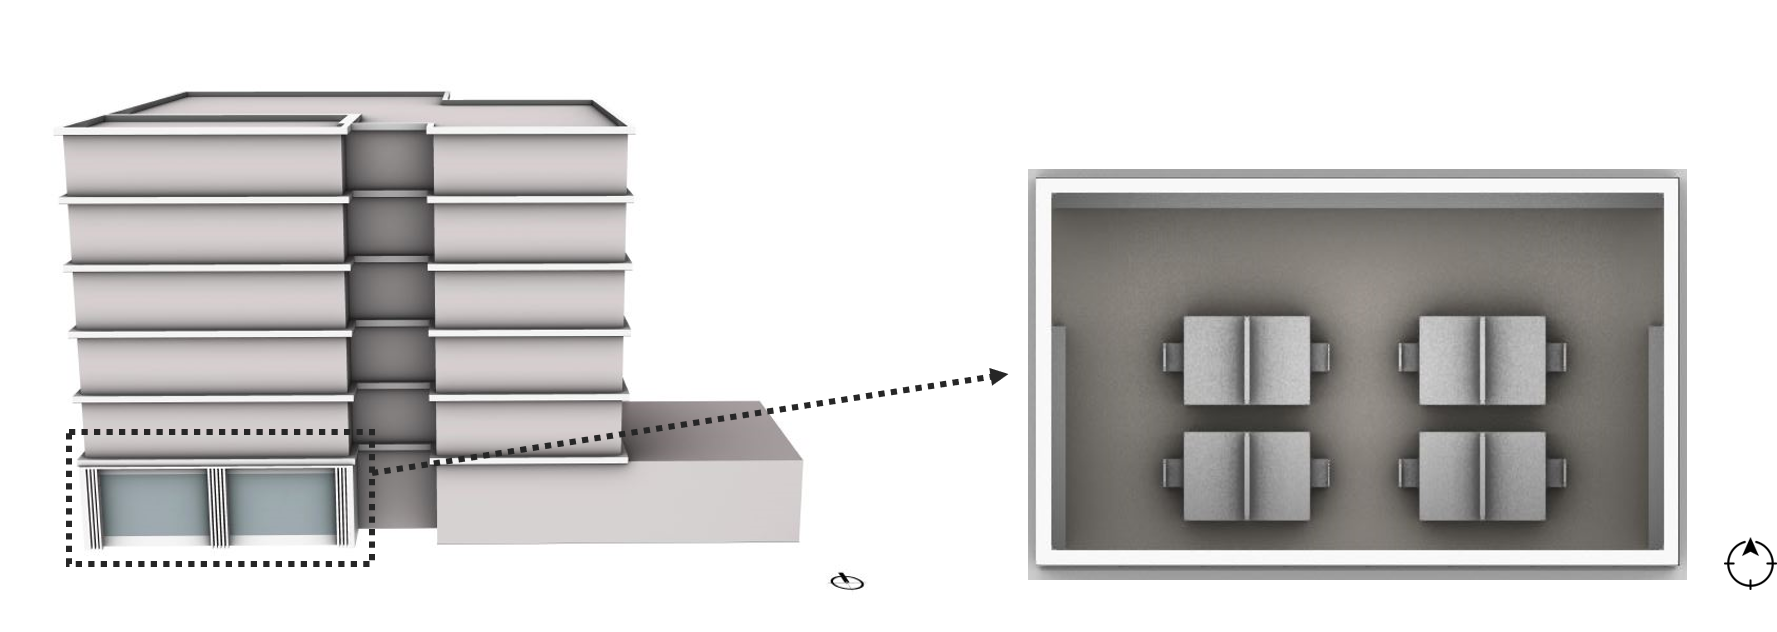
The data of this office for which heating and cooling loads calculations are made are as follows.
- Equipment load: 10.33 W/m²
- Lighting load: 10.54 W/m²
- Flow per person: 0.00236 m³/h
- Flow per area: 0.000305 m³/s per m²
- Infiltration: 0.000569 m³/s per m²
The U (heat transfer coefficients or thermal transmittances) values of the materials that are critical for the calculation are as follows.
- Wall: 0.54
- Floor: 0.30
- Roof: 0.17
- Window: 1.3
With these inputs, the number of people per square meter was accepted as 0.05 and the calculations were made annually (8760 hours).
The annual heating and cooling loads of this space (in its current state) was calculated without using any shading device. Heating load: 6933 kWh cooling load: 5734 kWh.
Afterwards, it was aimed to minimize these loads with the energy efficient building design approach. Accordingly, two types of shading devices were preferred to examine the effect of shading devices in the office.
- Alternative 1: 80cm width, 320cm length, 6 pieces and
- Alternative 2: 40cm width, 320cm length, 10 pieces
The above alternatives were selected as horizontal, aluminum composite panel models (Figure 2).

Analysis of these two types of shading devices was performed when the angle was 0° (perpendicular to the vertical plane). With this angle value, when the panel with 40 cm width is preferred, the heating load is 7894 kWh and the cooling load: 3986 kWh. Again, with this angle value, when the panel with 80 cm width is preferred, the heating load is: 8669 kWh and the cooling load: 3615 kWh.
According to these results, for the 40cm width shading device , the angle was 0° (perpendicular to the vertical plane), while 13.87% loss in heating load and 30.47% gain in cooling load compared to the current situation. For the 80cm width shading device, the angle was 0° (perpendicular to the vertical plane), while 25.03% loss in heating load and 36.95% gain in cooling load according to the current situation.
This placement (perpendicular to the vertical plane) is widely used for shading devices; but not always the best performance is achieved with this placement. For this reason, we need to evaluate the placement angles of the shading devices to reduce the heating and cooling loads of the space. With this approach, the positioning of the panels made with the vertical plane at angles of -60°, -50°, -40°, -30°, -20°, -10°, 0°, +10°, +20°, +30°, +40°, +50°, +60° are evaluated to reduce the heating and cooling loads.
The graph of heating and cooling loads according to the positioning angles of the panels with 40cm width is as follows.


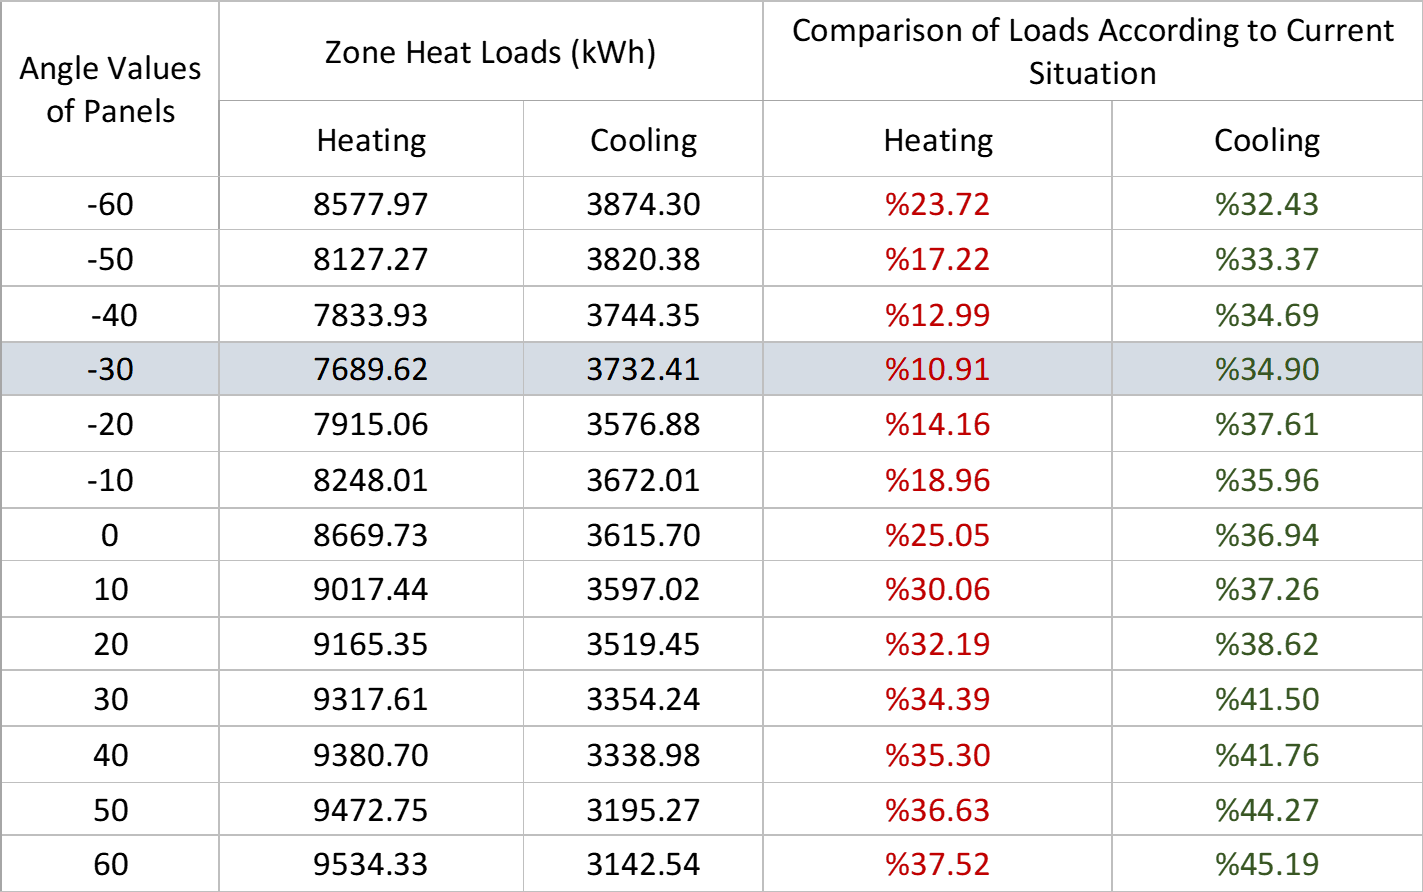
The graph of heating and cooling loads according to the positioning angles of the panels with 80cm width is as follows.


In addition to these graphs, in order to better read the effect of shading devices, the losses (in red) and gains (in green) of the 40cm panels in Table-1 and of the 80cm panels in Table-2 are shown. For example, when we look at Table-1, it is read that the placement with -30° angle causes an extra energy consumption of 7.23% in the heating period compared to the current situation. In parallel with this, there is a decrease of 27.88% in the cooling load compared to the current situation. Thus, the gain of the cooling load, which is more expensive in terms of unit cost, provides an advantage when considering the total on a yearly basis.
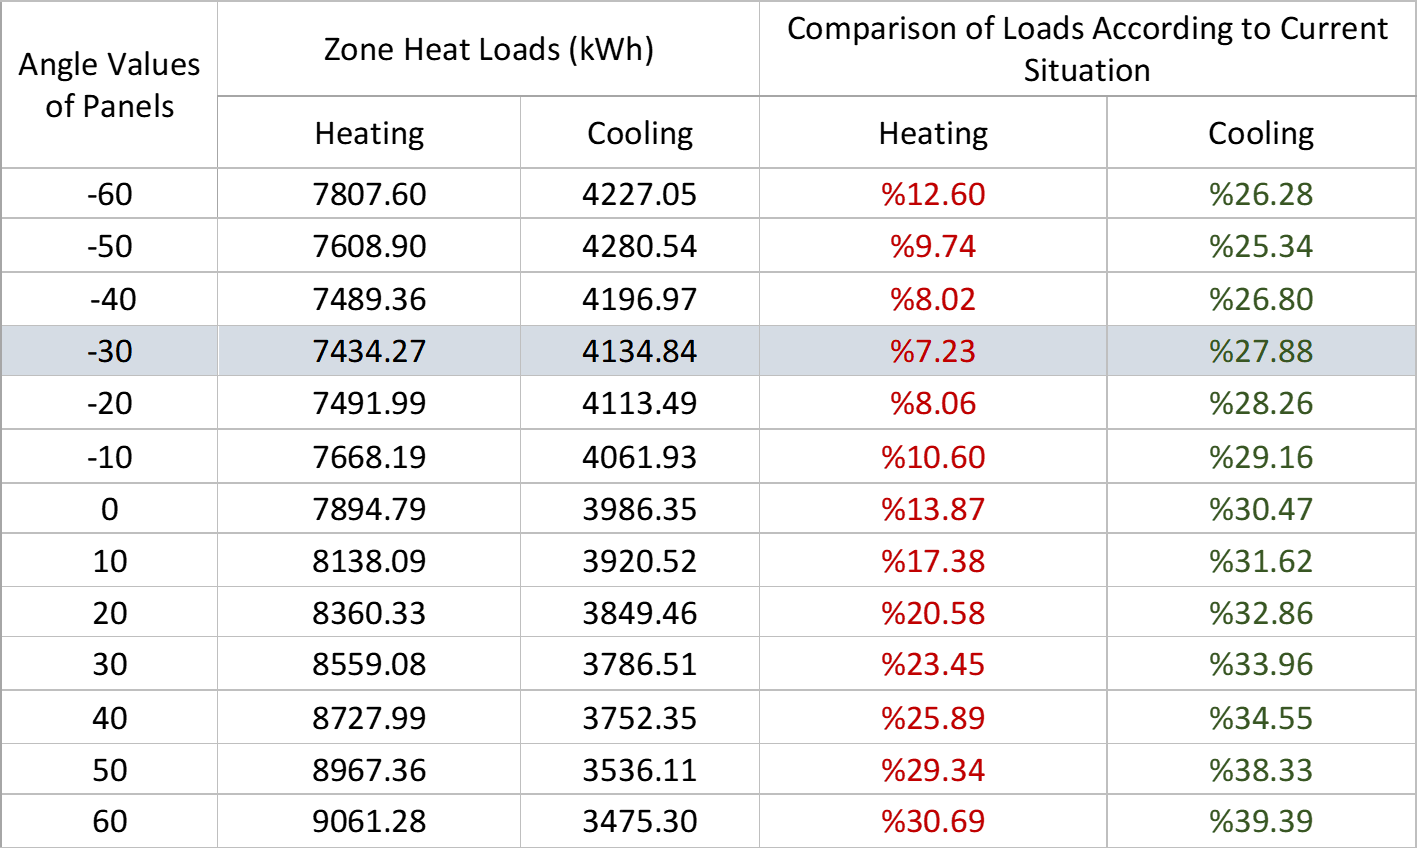
In these results, values with low heating loss and high cooling gain were selected. According to the graphics and the values in the tables, the best situation in which improvements were achieved was determined as position at an angle of -30°. For this position, the cooling gain is more critical than the heating loss. Because at the location where the work is completed, cooling generally depends on electrical energy and the unit price of electricity is more expensive than other energy sources. For this reason, making these calculations in the design and project stages is very important in terms of user comfort, investment, and operating costs.
In our previous article, placement of both 40cm and 80cm panels at -20° angle for daylighting gave the best result. When evaluated in terms of cost, it was seen that the 40cm panel was more suitable. In this study, as read from the tables, the placement of the 80cm panel at an angle of -30° was determined as the best placement in terms of heating and cooling load. It is known from the previous analysis results that the -30° panel position does not decrease the efficiency in terms of daylighting. In this way, preferences can be determined with the angle position that is efficient in energy consumption.
As a result of these studies, it will be determined how long the operating cost will offset (amortize) the investment cost by determining the energy consumption and material unit prices.