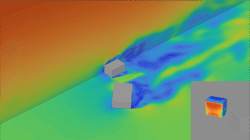
While closing last year with you, we mentioned that we will introduce all of our services in our exemplary building Pauze. While our preparations continue, we are examining our heating-cooling and daylight changes due to the high-rise (120m) building rising right next to the Pauze. In this approach, a study showing the relationship between the amount of daylight reaching Pauze usage areas and building energy consumption is presented. The daylight and energy consumption of the Pauze building, which does not have any natural lighting problems when the building next to it is 10 meters high, was examined in parallel with the increase in height. When the neighboring building in the south direction rose, the daylight coming to the building decreased, and in this case, the heating and cooling loads changed.
As a methodology, annual meteorological data and sun and sky conditions were taken into account in the analyzes, instead of a few daylight studies made at selected times with climate-based daylight modeling. The analysis process was advanced by estimating various radiative or luminance properties.
When interpreting daylight analysis output, the amount of useful daylight (Useful Daylight Illuminance- UDI)
Low daylight (UDI-f),
Sufficient daylight (UDI-a) and
It was described by the excess daylight (UDI-e) parameters.
Setting only a lower limit on the amount of daylight the space receives may cause problems such as overheating and glare to be unnoticed. In this way, it can be clearly understood that the reason for the decrease in daylight in the graphics is due to the fact that the daylight is taken into the space more or less.
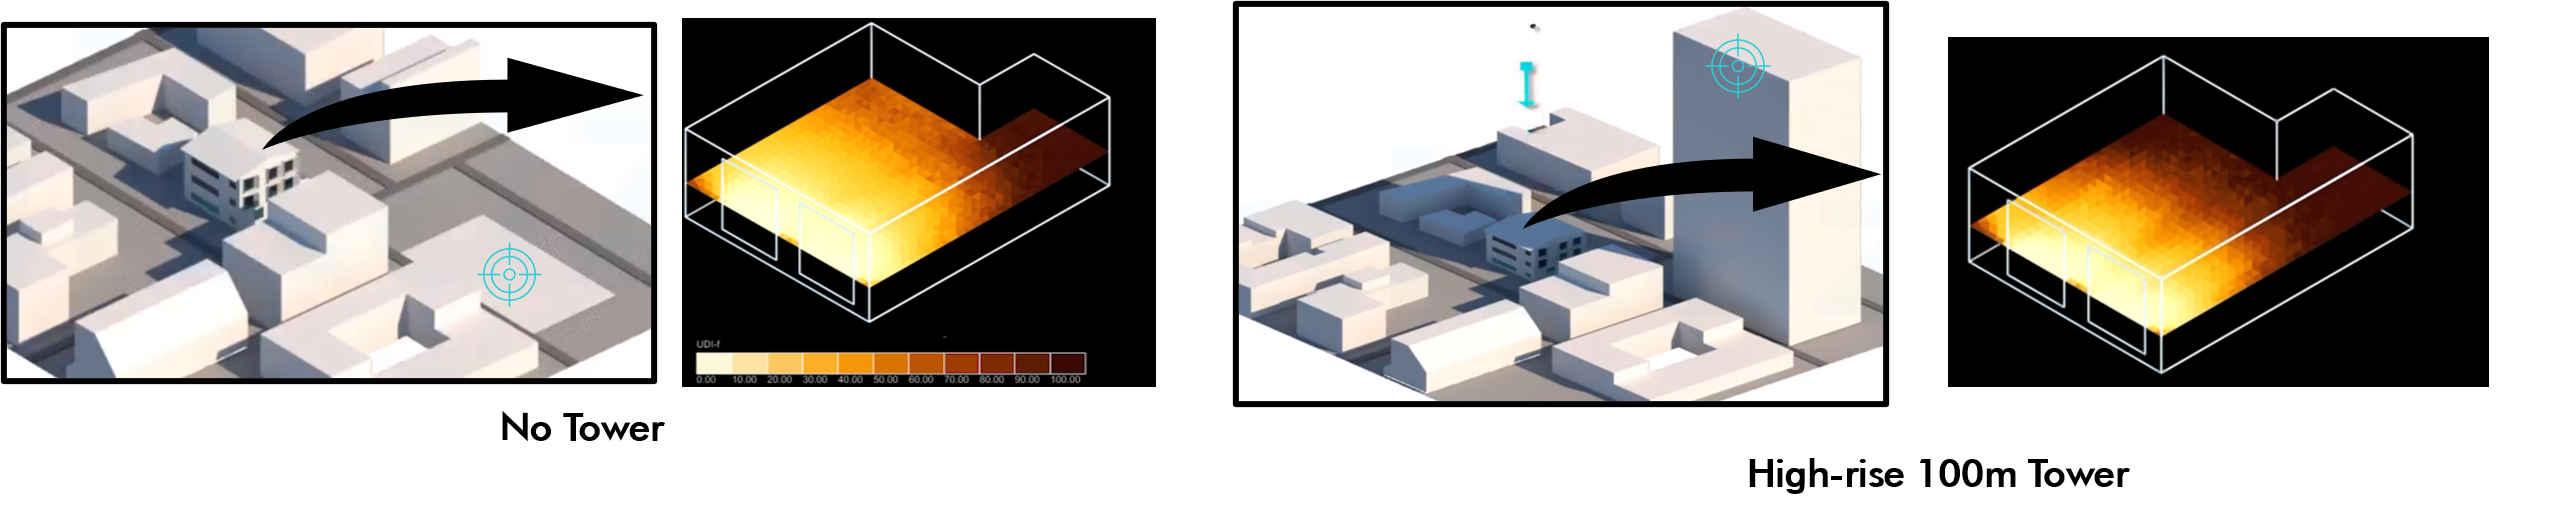
The sum of the UDI-f, UDI-a and UDI-e values will always be equal to 100, as it represents the total amount of illumination received by the volume. The change can be analyzed through this distribution.
The distribution of daylight performances within the volume can be examined clearly in the luminance distribution in perspective section visuals in the video. Less sunlight (high UDI-f value) and excess daylight near the opening (high UDI-e value) can be read into the depths of the volume. If we examine the monthly change of heating loads:
When the height of the neighboring building is increased from 0 to 70m, the increase in heating loads increases dramatically. In the increases after 70m, there is no big difference in the changes in the heating load.
For a space in ASHRAE climate zone 5, such as Amsterdam, where the heating load is important, one of the important parameters affecting the heating load is sunlight. Conversely, this has had an effect on the cooling load, but this is not significant compared to the heating load. Of course, the increase in load (kWh) value of 3.5% in total should be evaluated with the loss of comfort in daylight and its cost. In the monthly change of cooling loads:
There is a decrease in cooling loads from 0 to 100m. The decrease in load is almost 22%, mainly due to direct solar radiation. Energy loads are a consequence and what needs to be solved is its approach to building design. It will be even more depressing to have a skyscraper that makes a shadow while the level is already low due to cloudiness on the annual average in terms of natural daylight. Making quick examinations with the methods we use will benefit decision makers, designers and site users.