

Alkazar · October 2026 · Author: Güven Fidan
Summary
- A very strong El Niño is under way in the tropical Pacific. NOAA’s 8 October 2026 assessment puts the Niño-3.4 sea surface temperature anomaly at +2.1 °C, gives an 83% chance that the October-December value exceeds, on NOAA’s relative index, every El Niño on record since 1950, and a greater than 83% chance that the event stays strong to very strong through January-March 2027.
- The October 2026 update of the Alkazar Seasonal Climate Outlook expects Türkiye’s November 2026-March 2027 precipitation to be 40% above the 2021-2025 average, 12% above the 1991-2020 normal and 13% below last winter (2025/26). The monthly pattern is uneven: December slightly below normal, November and January-March above. The national result is robust to the calculation method; differences between regions are not.
- In a 35-winter reanalysis record there is no significant relationship between El Niño and Türkiye’s winter precipitation (r = +0.09; p = 0.62). Only one of the four strong El Niño winters was markedly wet; last winter’s 35-year record came under La Niña conditions. There is no basis in the historical record for attributing this winter’s wet tilt to El Niño; the tilt comes from the forecast system computing the whole ocean-atmosphere state, El Niño included.
- Bias-corrected temperature runs 1 to 2 °C above the 1991-2020 normal and close to the 2021-2025 average. Confidence is low for November-January. For hydropower the main consequence is the form and timing of precipitation rather than its amount: rain instead of snow, higher winter flow, lower spring-summer flow.
- Winter evaporative demand is 15% of the annual total, so winter precipitation contributes strongly to the water budget. Water stress is decided in April-September, and that requires indices that account for temperature and evaporation (SPEI).
1. Where El Niño stands
NOAA’s Climate Prediction Center kept the “El Niño Advisory” status on 8 October 2026: El Niño is established and still strengthening. The Niño-3.4 anomaly is +2.1 °C. The probability that the three-month mean exceeds +2.5 °C is 54% for September-November, 83% for October-December and 70% for November-January. The chance of a strong or very strong event persisting through January-March 2027 is above 83%. The next assessment is due on 12 November 2026.
The World Meteorological Organization’s update of 3 September 2026 gives the same picture: a “near 100%” probability that El Niño continues through February 2027, a peak toward the end of 2026 and impacts carrying into 2027. The same release carries two warnings: the strength of an El Niño alone does not determine the severity of impacts in any country, and impacts vary by region and season. The Turkish State Meteorological Service relayed this release on 3 September with the same caveats and made no Türkiye-specific impact claim.
“Super El Niño” and “mega El Niño” are media labels, not official categories. NOAA uses weak, moderate, strong and very strong (+2.0 °C and above); +2.5 °C means exceeding the highest three-month value since 1950 on the relative index NOAA now uses (on the classic ONI scale used in the 35-winter analysis below, the 2015/16 winter stands at +2.59; the two scales are not directly comparable).
2. Does El Niño decide Türkiye’s winter?
2.1 What the literature says
Peer-reviewed work on Türkiye is consistent. Karabörk and Kahya (2003) found a coherent wet signal in El Niño years in western Anatolia for April-July and in eastern Anatolia for February-June, with no signal in the core winter months (December-February). Karabörk, Kahya and Karaca (2005), using 94 stations, found the North Atlantic Oscillation’s link to winter precipitation fully significant and the Southern Oscillation’s link weaker and significant at fewer stations. Kahya and Karabörk (2001) reported above-normal streamflow in El Niño years in the Susurluk basin for April-October and in eastern Anatolia for April-November: spring and summer flow, not winter.
For the wider region, Mariotti, Zeng and Lau (2002) showed that the ENSO-rainfall relationship over Europe and the Mediterranean changes with season, with the Mediterranean signal concentrated in autumn and spring. A 2026 synthesis for the Middle East (de Vries et al., in review) summarises a tendency toward more cool-season rain under El Niño, strongest in autumn, weak in winter, modest in spring, and shifting across decades. For northern Israel, Price et al. (1998) found wetter El Niño winters, but only from the 1970s onward and without a guarantee that strong events bring the largest anomalies.
In short: Türkiye’s winter precipitation is governed largely by the North Atlantic and Arctic oscillations; El Niño’s imprint is weak, variable and concentrated in autumn and spring.
2.2 Our own 35-winter analysis
We tested the literature against our own data. For the 35 winters from 1991/92 to 2025/26 we compared Türkiye’s land-area mean November-March precipitation (10 km reanalysis data, expressed as a departure from the 1991-2020 normal) with NOAA’s November-January ONI.
| Measure | Value |
|---|---|
| Pearson r (Nov-Mar precipitation departure vs ONI) | +0.09 (p = 0.62; 95% confidence interval -0.25 to +0.41) |
| Spearman ρ | +0.11 (p = 0.54) |
| El Niño winters (ONI ≥ 0.5; n = 12), mean departure | +2.4% |
| La Niña winters (ONI ≤ -0.5; n = 14) | -3.7% |
| Neutral winters (n = 9) | -3.1% |
| Strong El Niño winters (ONI ≥ 1.5; n = 4) | -3.7% (1997/98 -3.7%; 2009/10 +26.4%; 2015/16 -7.5%; 2023/24 -30.1%) |
| Autumn (Oct-Dec) r | +0.17 (p = 0.34) |
| Eastern Türkiye (east of 35°E), Nov-Mar r | +0.22 (p = 0.20) |
| Linear estimate for ONI = +2.3 (assumption; +2.5% for +2.6) | +2% (90% prediction interval: -35% to +39%) |
Five wettest winters: 2025/26 (+29%, ONI -0.60; 0.2 points ahead of 2018/19), 2018/19 (+29%), 2009/10 (+26%), 2001/02 (+26%), 2014/15 (+21%). Five driest: 2022/23 (-58%), 2000/01 (-37%), 2013/14 (-30%), 2023/24 (-30%), 2006/07 (-27%).
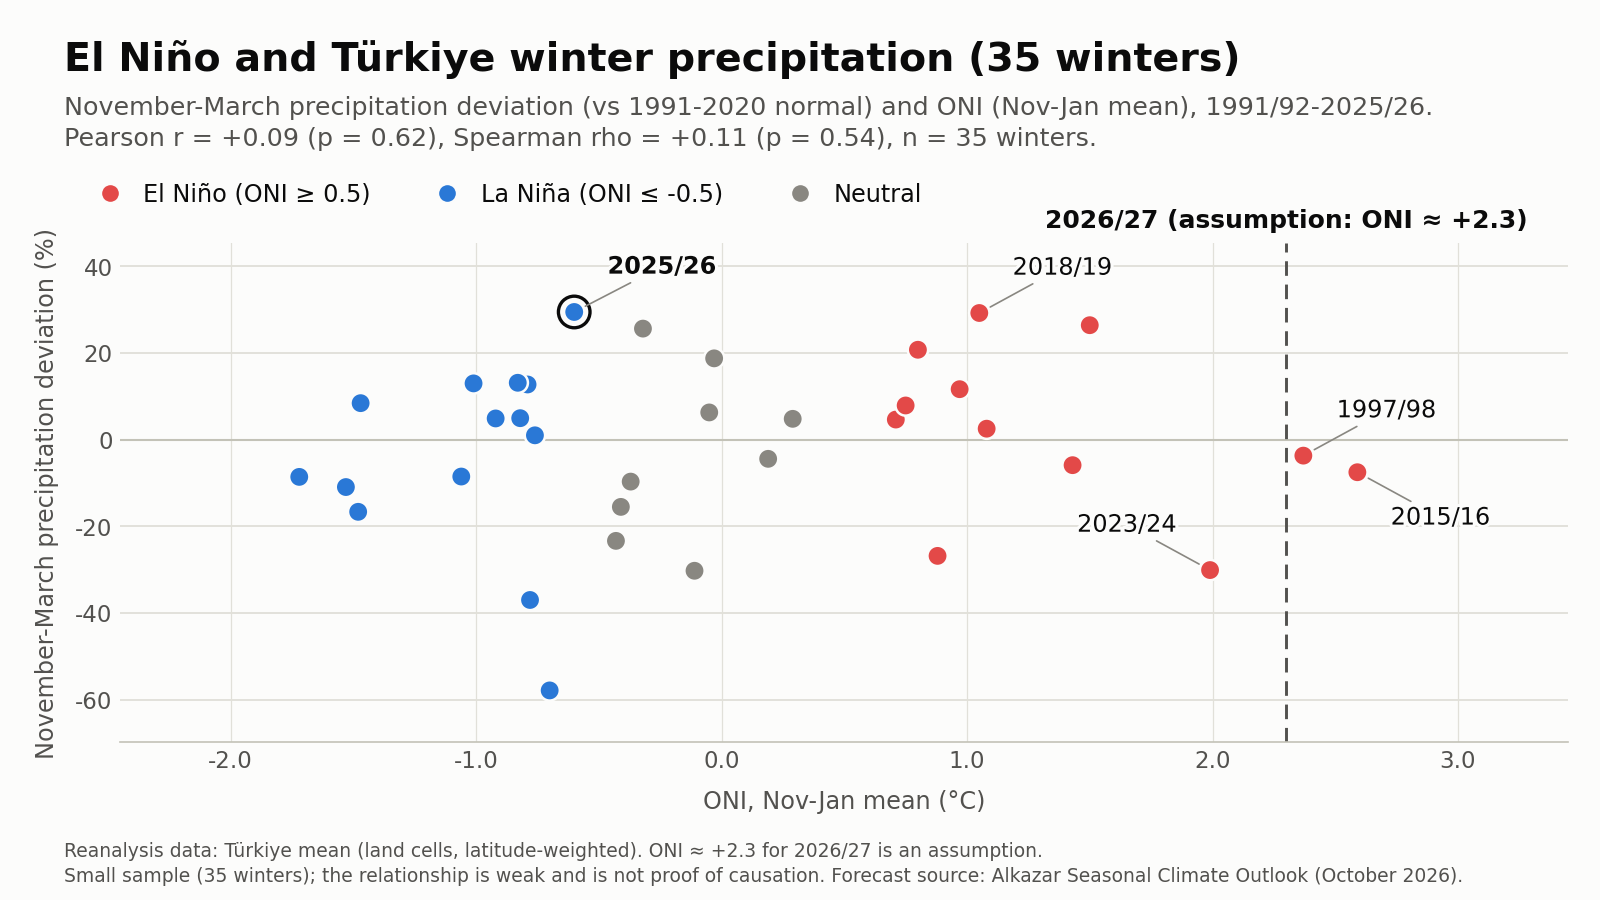
Conclusion: the relationship is statistically indistinguishable from zero; the autumn and eastern-Türkiye signs agree with the literature (positive) but are not significant. Of the four strong El Niño winters, one was very wet (2009/10), one very dry (2023/24) and two near or slightly below normal (1997/98, 2015/16). Last winter (the wettest of the 35, 0.2 points ahead of 2018/19) came under weak La Niña conditions. The sentence “El Niño is coming, so winter will be wet” cannot be built from Türkiye’s data; at the same time a 35-winter sample cannot rule out a moderate link (see the confidence interval above).
This does not mean El Niño plays no role. Seasonal forecast systems solve the ocean and the atmosphere together, and El Niño is part of that solution. But the precipitation tilt that comes out for Türkiye is not a rule derived from El Niño; it is the computed result of the whole state, including the Atlantic, the Mediterranean and the Indian Ocean. The October forecast being well above normal may be consistent with the weak autumn signal in the literature; the same cannot be said for winter.
3. Last water year and the “relative to what” problem
According to the Turkish State Meteorological Service’s areal precipitation data, the first 11 months of the 2026 water year (1 October 2025 to 31 August 2026) brought 709.2 mm to Türkiye as a whole: the normal is 548.5 mm (+29%), and the same period a year earlier had 401.1 mm (+77%). It is the highest value in 66 years of records. The monthly path was uneven: November 2025 was 43% and December 21% below normal; January 2026 was 49%, February 129% and March 33% above. February 2026 was the wettest February on record. The 2025 calendar year, by contrast, was the driest since 1964.
That swing exposes the most common mistake in reading seasonal outlooks: the baseline. The default baseline in the Alkazar Seasonal Climate Outlook grid maps is the reanalysis mean of the same calendar month over the last five years (2021-2025); it contains the 2025 drought but not the record 2026 winter (in our district table the January-March baseline also includes 2026; a correction is in progress). In the reanalysis record, the 2021-2025 November-March mean is 20% below the 1991-2020 normal (37% below in February). For temperature, the 2021-2025 mean is 1.4 °C warmer than normal. Hence “+40% relative to the last five years” and “+12% relative to normal” are the same forecast, as are “+0.2 °C relative to the last five years” and “+1.6 °C relative to normal” for the bias-corrected temperature (see section 5). All tables below show both baselines in separate columns.
4. The 2026/27 winter outlook: precipitation
Forecast: Alkazar Seasonal Climate Outlook, October 2026 update (initialised 1 October), valid November 2026-March 2027. Türkiye means are latitude-weighted over land cells; percentages are ratios of totals (not means of percentages) and are computed from unrounded values.
| Month | 1991-2020 normal (mm) | 2021-2025 mean (mm) | Last winter 2025/26 (mm) | Forecast 2026/27 (mm) | Forecast vs 2021-2025 | Forecast vs normal | Forecast vs last winter | Area share in medium/high confidence class* |
|---|---|---|---|---|---|---|---|---|
| November | 63 | 50 | 38 | 77 | +56% | +22% | +104% | 20% |
| December | 81 | 62 | 77 | 76 | +22% | -7% | -1% | 72% |
| January | 82 | 65 | 125 | 93 | +44% | +14% | -26% | 60% |
| February | 73 | 46 | 151 | 89 | +94% | +22% | -41% | 10% |
| March | 81 | 82 | 102 | 92 | +12% | +14% | -9% | 16% |
| Nov-Mar | 380 | 304 | 492 | 427 | +40% | +12% | -13% |
*The confidence class is based on how well past forecast trials matched observations; “medium” means weak and “high” moderate skill. All mm values are on the reanalysis scale and differ markedly from official station statistics (the November-March normal is 380 mm in the reanalysis and 325 mm in the official areal data; last winter 492 mm and 415 mm); percentages are closer (for example February 2026 is 108% above normal in the reanalysis and 129% above in the official data). Do not compare absolute mm values with official figures.
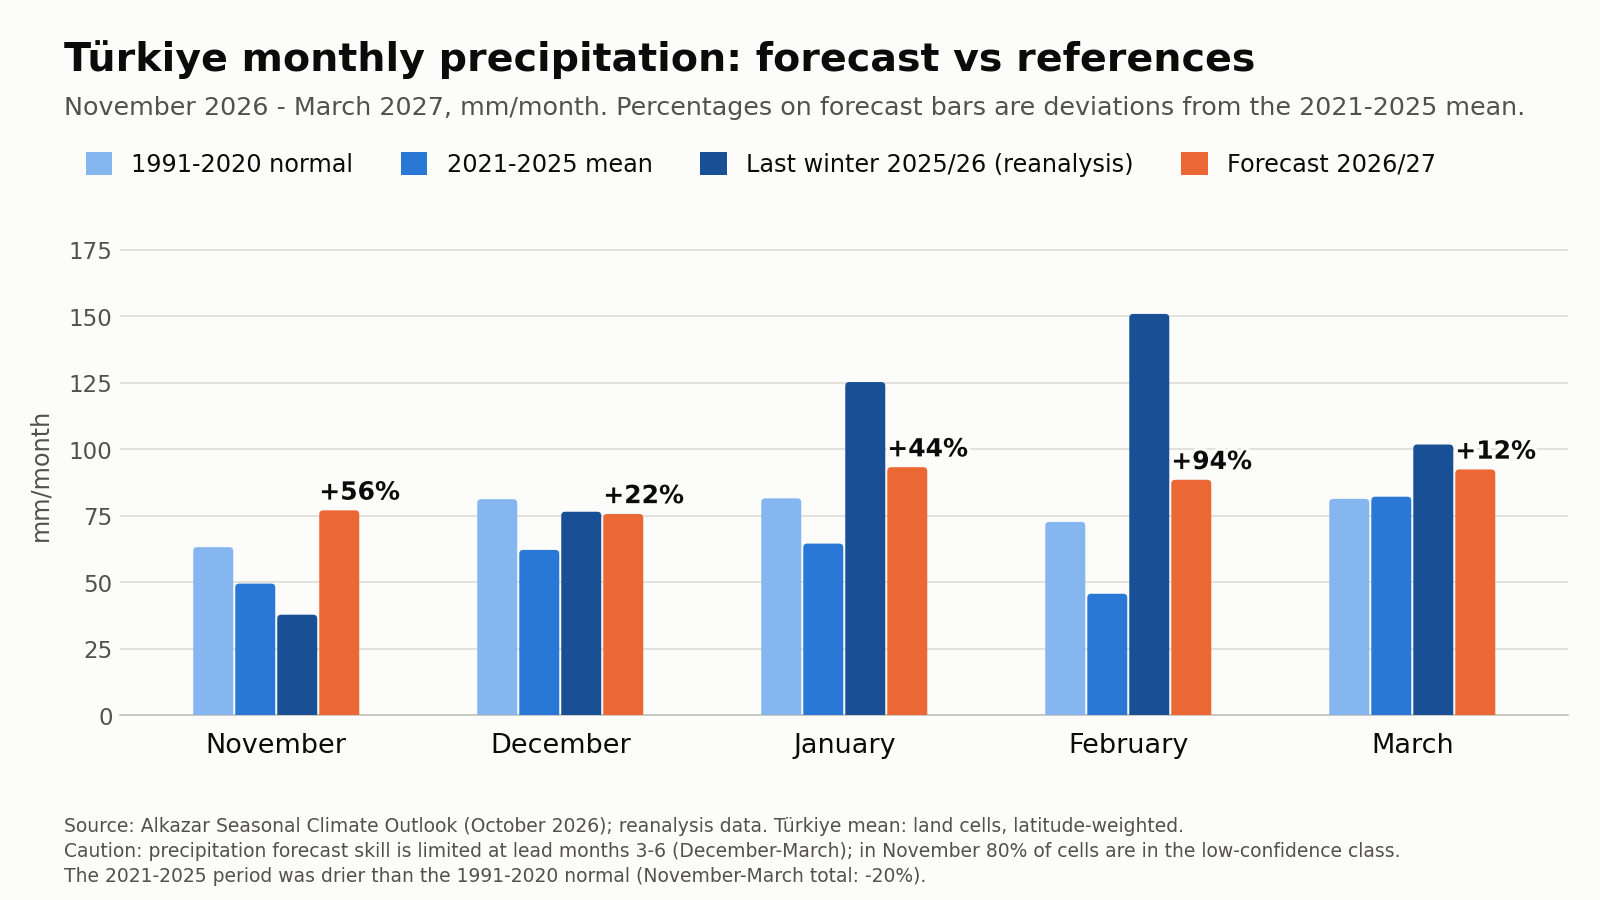
Reading: a strong wet signal in November; December near normal (slightly below); January-March above normal. The “+94%” in February comes mostly from a very dry February baseline (the 2021-2025 February mean is 37% below normal); relative to normal the increase is 22%, and confidence in that month is low. The area share in the medium/high confidence class is highest in December and January (60-72%); even so, these months are 3-4 months ahead and precipitation skill is limited.
4.1 Regions
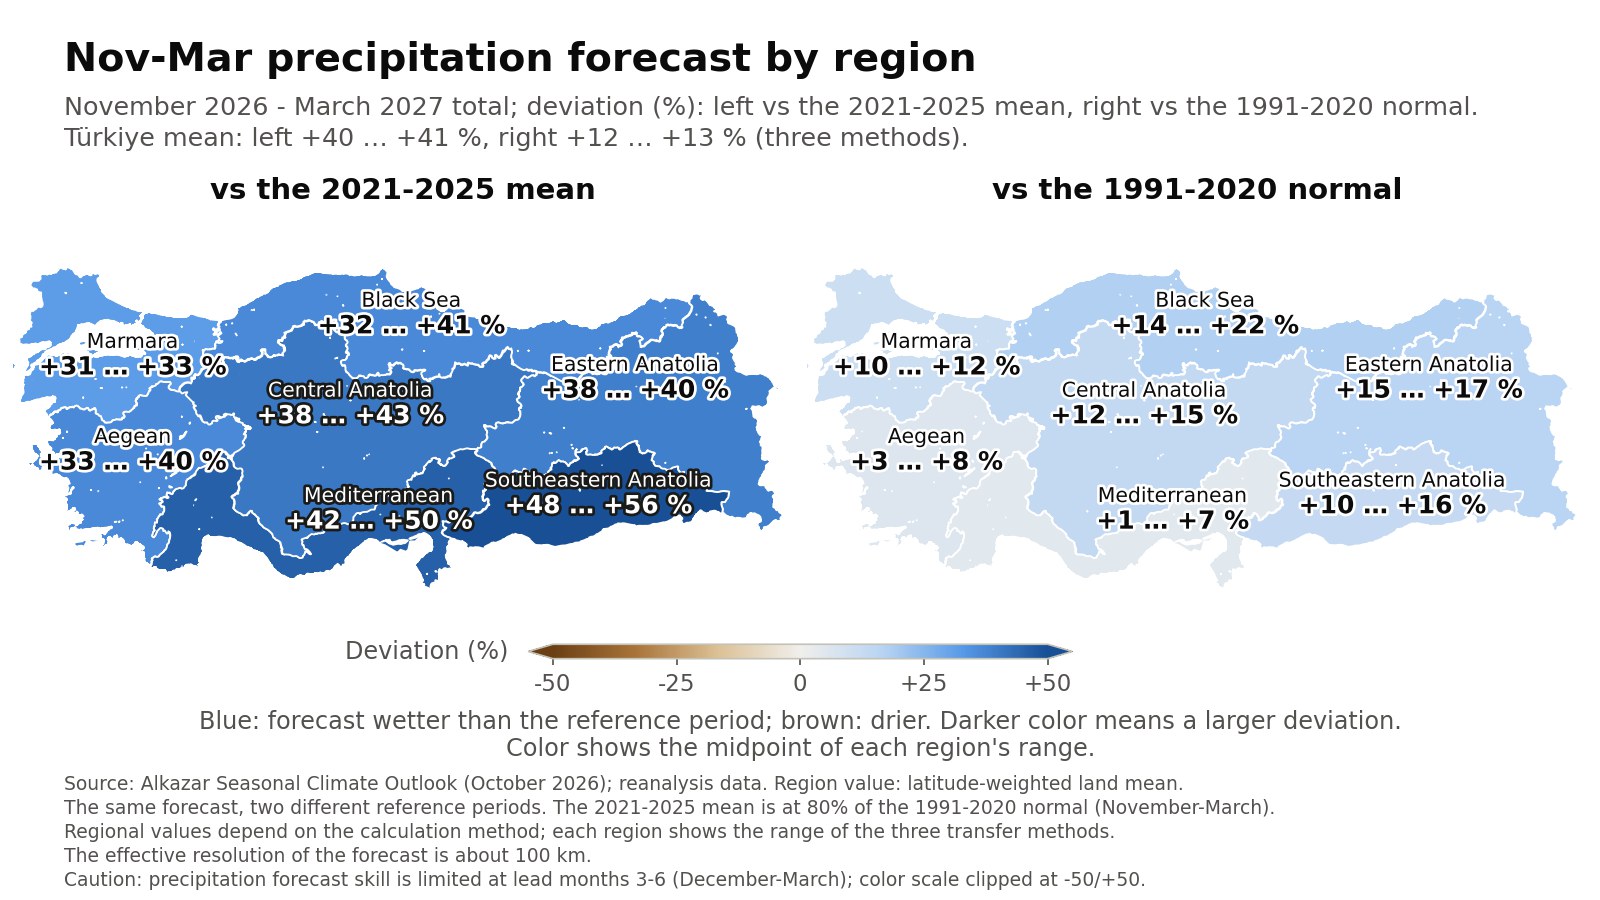
Regional values are sensitive to the calculation method because of the forecast’s resolution. The forecast system carries information at a scale of about 100 km (1 degree); transferring it to a 10 km grid spreads that information over the local climate. When the transfer method changes, the national mean stays between +12% and +13% (robust), but the ranking of regions changes. For that reason the table below does not declare any one method “correct”; it shows, for each region, the range given by three different transfer methods.
| Region | Forecast vs 2021-2025 (range of three methods) | Forecast vs 1991-2020 normal (range of three methods) |
|---|---|---|
| Marmara | +31 to +33% | +10 to +12% |
| Aegean | +33 to +40% | +3 to +8% |
| Mediterranean | +42 to +50% | +1 to +7% |
| Central Anatolia | +38 to +43% | +12 to +15% |
| Black Sea | +32 to +41% | +14 to +22% |
| Eastern Anatolia | +38 to +40% | +15 to +17% |
| Southeastern Anatolia | +48 to +56% | +10 to +16% |
| Türkiye | +40 to +41% | +12 to +13% |
Note: the national monthly table in section 4 rests on the forecast’s published grid values; for the national total every transfer method gives almost the same result (+40 to +41%; +12 to +13%).
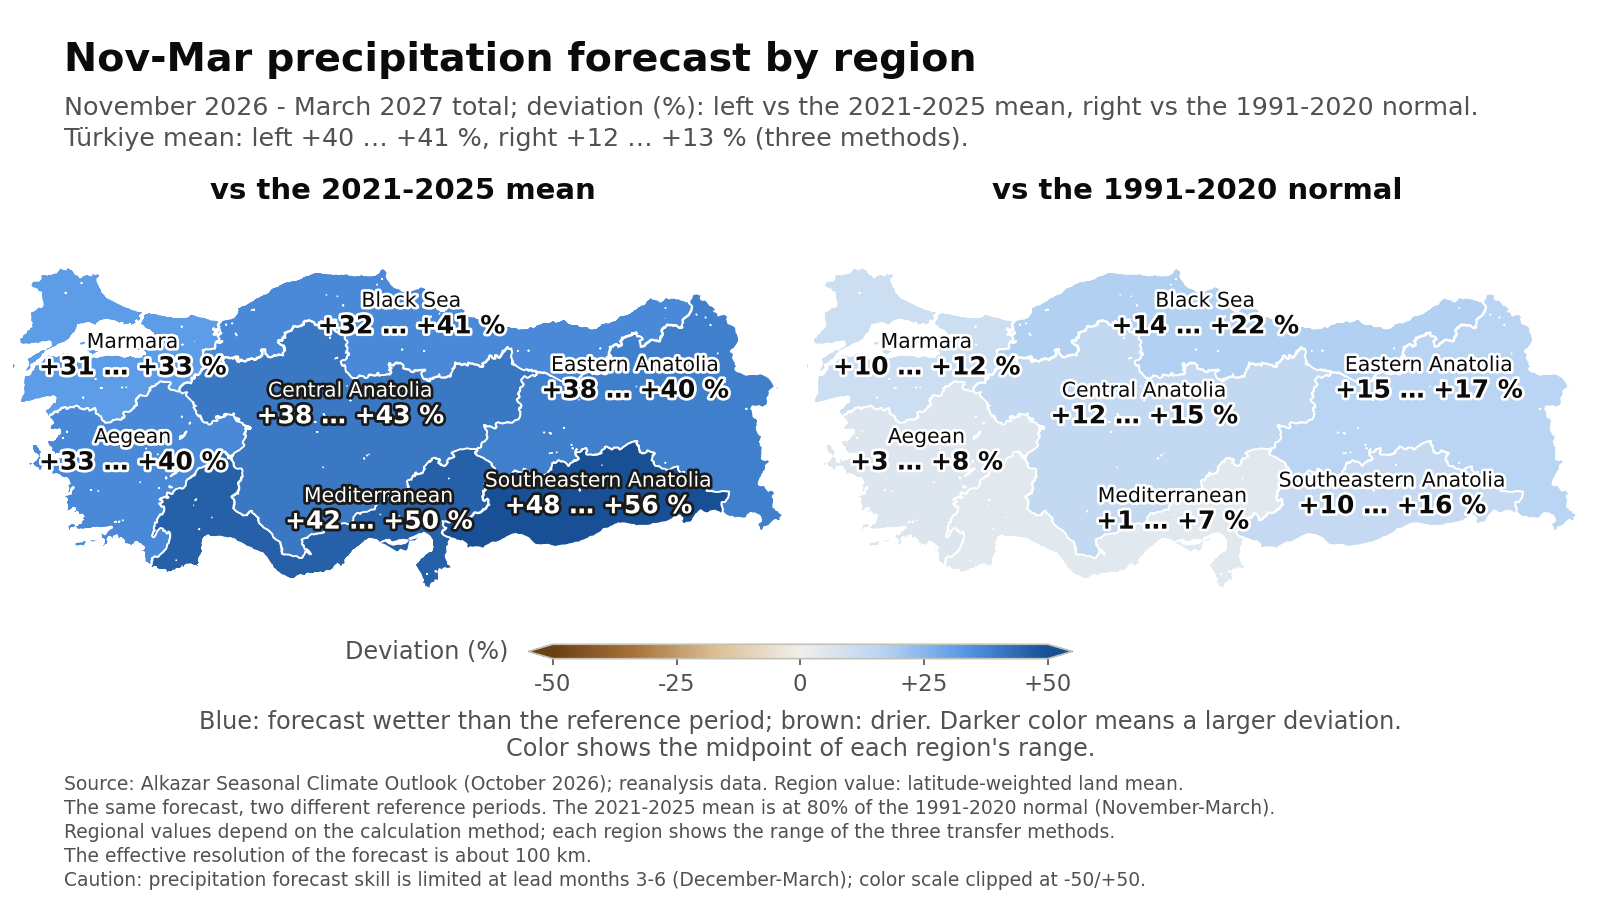
Reading: under every method most of the country is above normal; regional values relative to normal lie between about +1% and +22%. Regional differences are not reliable at this forecast’s resolution: the forecast does not separate which region will be wetter, it says “slightly above normal across most of the country”. We give no numbers at basin scale (Kızılırmak, Euphrates, Çoruh, the eastern Black Sea coast and the like); at that scale the methods can even change sign. In coastal provinces the 10 km normal is coarse; the official State Meteorological Service normals should be used there.
4.2 October
October 2026 is the first month of the update and carries the highest skill. In the Türkiye area mean, the October forecast was about 60% above the 1991-2020 normal; the increase was concentrated in the south and east (the Southeast, Eastern Anatolia, the Mediterranean), while a near- or below-normal October was expected in the Black Sea and Marmara regions. The official October assessment will be published by the State Meteorological Service at the end of the month.
5. Temperature and snow
The raw temperature output of the forecast system (shown on our live maps as -1.0 °C relative to the last five years) carries a known cold bias in this region in winter; when the bias learned from past forecast trials (an area mean of 1.1 to 1.7 °C for December-March) is removed, the Türkiye mean is:
| Month | vs 1991-2020 normal (°C) | vs 2021-2025 mean (°C) |
|---|---|---|
| November | +0.9 | -1.2 |
| December | +1.4 | -0.7 |
| January | +2.1 | +0.1 |
| February | +2.3 | +1.7 |
| March | +1.3 | +1.0 |
| Nov-Mar | +1.6 | +0.2 |
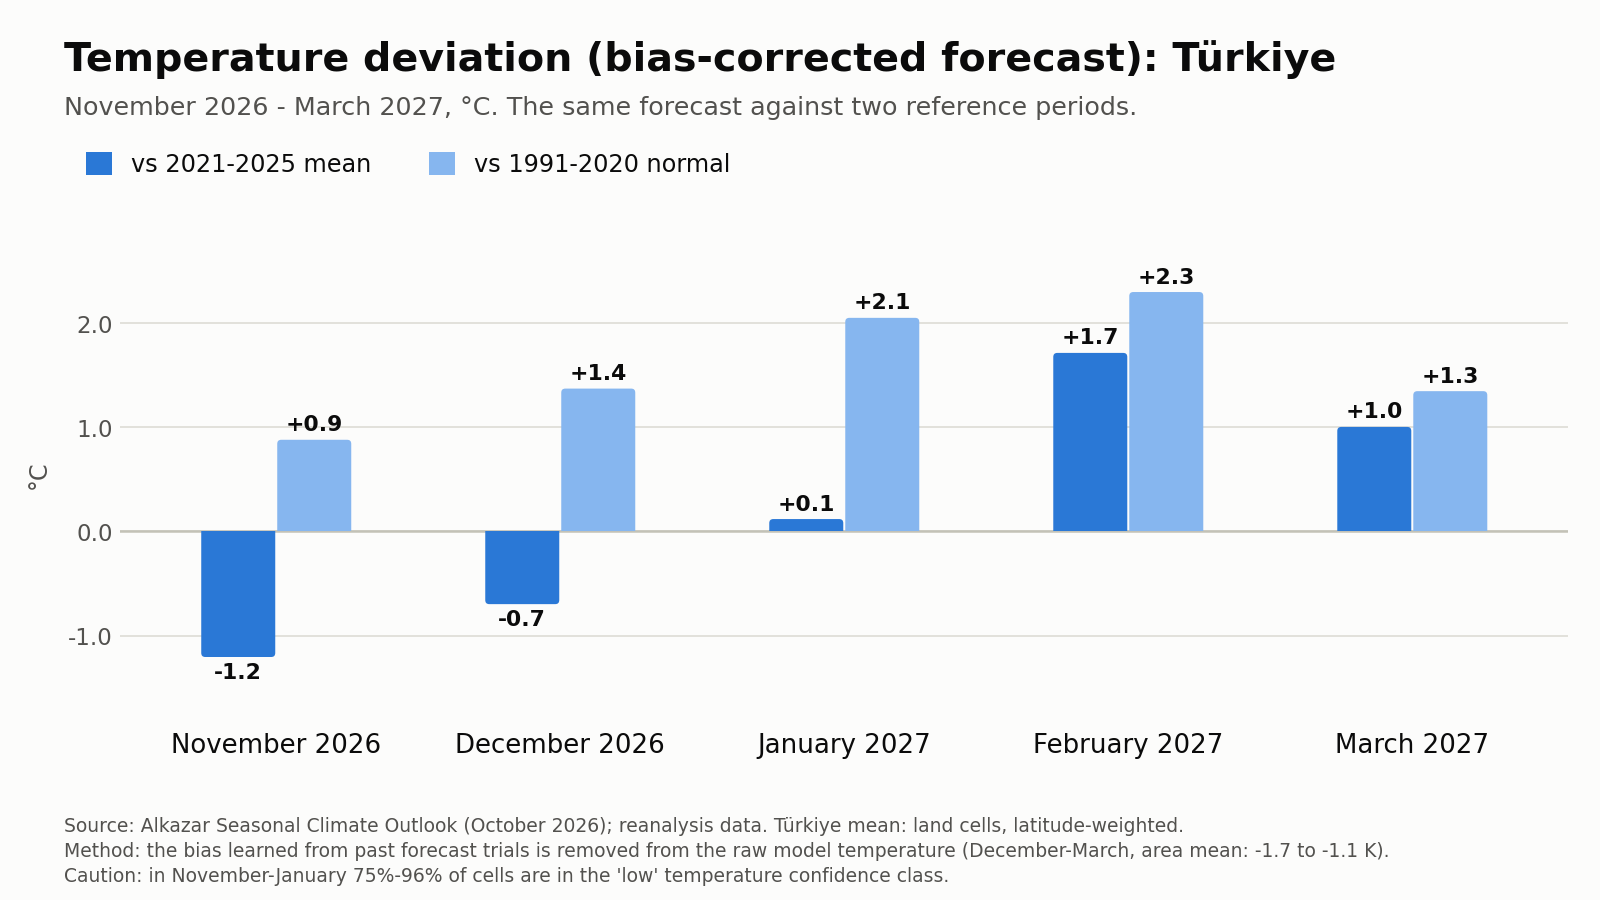
Three caveats. First, the temperature confidence class is “low” in 75-96% of land cells for November-January; in February the medium/high share is 55%. Second, because the 2021-2025 baseline is 1.4 °C warmer than normal, “cooler than the last five years” is misleading on its own; relative to normal, a mild winter is expected. Third, the State Meteorological Service’s seasonal outlook of 5 October also gives November at 0.5 to 2 °C above normal in most regions; the two sources point the same way. As with precipitation, regional temperature differences fall within the method uncertainty (about ±0.5 °C), so we give no regional temperature figures.
What matters for hydropower is not temperature itself but the snow line. A winter 1 to 2 °C above normal turns part of the precipitation that would accumulate as snow at high elevations into rain and brings the melt forward. Yücel, Güventürk and Şen (2015), analysing 15 gauges in the Euphrates, Tigris, Aras and Çoruh basins of eastern Türkiye, measured a roughly nine-day advance in runoff timing (significant at 8 of the 15 gauges) alongside a temperature rise of about 1.3 °C; studies of the upper Euphrates project a 30-39% decline in snow water equivalent by the end of the century (Peker and Sorman, 2021). The scenario for this winter: higher winter flow, an earlier and smaller spring peak, lower early-summer flow. An opportunity for reservoir plants in winter; a spring-summer risk for run-of-river plants.
6. Evaporation and drought indices
In the reanalysis record, only 15% of Türkiye’s annual evaporative demand (potential evaporation) falls in November-March, while the same five months carry 54% of annual precipitation. In December and January precipitation exceeds evaporative demand by about 30 mm on average. This is why winter precipitation contributes so much to the water budget: water that falls in winter largely goes to soil, snowpack, rivers and reservoirs.
The evaporative demand in the forecast product is computed with a simple temperature-only formula and gives very small winter values (below 5 mm in a third to more than half of the cells in December-February), so percentages mislead easily. On that measure the November-March departure from the last five years (2021-2025) is about -3% and should not be used as a decision input; for winter, precipitation and snow in mm should be tracked instead of an evaporation anomaly.
Three notes on drought indices:
- SPI (Standardized Precipitation Index) looks at precipitation only. The 3-month window (SPI-3) tracks meteorological drought; the 6- and 12-month windows (SPI-6, SPI-12) track agricultural and hydrological drought. Long windows are the relevant ones for reservoirs and groundwater. In the October update the winter SPI-3 sits clearly on the wet side relative to the last five years; that is the precipitation table above expressed in index language.
- SPEI (Standardized Precipitation-Evapotranspiration Index) subtracts evaporative demand from precipitation, so it accounts for temperature. In winter the two indices say almost the same thing (evaporation is small). The gap opens in April-September: with the same precipitation, a warmer summer looks drier in SPEI. For water stress and hydropower this is the right measure.
- Long-window indices still carry last winter’s record: according to official data, precipitation in the first 11 months of the water year (October 2025-August 2026) was 29% above normal, so 12-month indices are expected to sit on the wet side this autumn. Hydrological drought risk is low for this winter; the real question is the summer of 2027 and beyond.
7. Implications for hydropower and water management
Context: in 2025 hydropower generation fell to 57.2 TWh, 22% below the previous year (73.1 TWh); its share dropped to 16% and natural gas filled the gap. In 2026 the picture reversed: hydropower took first place in February with a 30% share, April and May set monthly records (11.7 billion kWh), and January-August output reached 74.4 TWh, 31% of the total. But abundant water had a price: the second-quarter average market clearing price fell 61% year on year, dropped to zero in some midday hours in May, and according to industry representatives water carrying roughly 7 TWh of generation potential was released without generating over four months. In the long run, the average annual output of the Atatürk, Karakaya and Keban dams fell from 21.3 TWh in 1996-2005 to 15.1 TWh over the last decade (-29%); according to Ember, drought-driven annual swings across the whole hydropower fleet can exceed 20 TWh.
Implications for this winter:
- Amount: slightly above normal, below last year. Reservoir operation and generation plans should not assume a repeat of 2026. The expectation is 12% above normal for the November-March total, with December near normal.
- Timing: winter flow up, spring peak earlier. In the mild-winter scenario, reservoir plants can bring winter generation forward; run-of-river plants should leave a margin in March-June commitments. Snow observations (snow water equivalent) should be tracked in February-March.
- Basin differences are uncertain. The national mean is slightly above normal; this forecast does not reliably separate differences at basin scale. Portfolio decisions should rest on each basin’s own streamflow and snow data.
- The abundant-water scenario carries market risk. Spring 2026 showed it: zero-price hours and forced releases can erode the gains of a wet year. If above-normal flow and high reservoirs coincide in January-March, the irrigation calendar and market positions need to be planned together.
- Refresh the forecast monthly and weight the near months. Precipitation skill is limited 3-6 months ahead. The November update will refresh December-April and the December update January-May; the plan needs the same rhythm.
8. Uncertainty and rules of use
- The forecast is the mean of a multi-member ensemble; it shows the centre of possible winters, not a single realised winter. The actual winter can depart markedly from that centre.
- Precipitation skill is highest in the first 1-2 months and limited 3-6 months ahead; in this update even November has only 20% of the area in the medium/high confidence class. Decisions should rest on the monthly refreshed forecast with the nearest month weighted most; keep a wide range for February-March.
- The temperature confidence class is low for November-January in this update; the direction (above normal) agrees across two independent sources, the magnitude is uncertain.
- The national mean is robust to the calculation method; regional and basin differences are not. Sub-national numbers should be read as tendencies, and official normals should be used in coastal provinces.
- The baseline is stated with every number; “relative to the last five years” and “relative to the 1991-2020 normal” must not be mixed.
- Past values are reanalysis data; the authoritative source for official station statistics, warnings and official forecasts is the Turkish State Meteorological Service.
- This article is not investment advice; decisions at basin and plant scale should combine it with local data (streamflow, snow, reservoir storage).
9. Method note
The forecasts are based on the monthly output of a multi-member global seasonal forecast system. For each variable, past forecast trials are compared with reanalysis data and a statistical bias correction is applied; the result is interpolated to a 10 km grid (the forecast’s effective resolution is about 100 km) and aggregated to district level. Anomalies are given against two baselines: the reanalysis mean of the same calendar month over the last five years (2021-2025) and the 1991-2020 normal. Türkiye means are latitude-weighted over land cells; precipitation percentages are ratios of totals. For regional values three transfer methods were compared and the result is given as a range. In the ENSO analysis, the Türkiye-mean November-March precipitation for 35 winters was compared with NOAA’s November-January ONI using linear and rank correlation; composites use ONI ≥ 0.5 (El Niño) and ≤ -0.5 (La Niña). A reproducible record of every number is kept.
Sources
- NOAA Climate Prediction Center, ENSO Diagnostic Discussion, 8 October 2026; Oceanic Niño Index (ONI) table.
- World Meteorological Organization (WMO), “El Niño set to become very strong, raising risks of extreme weather into 2027”, 3 September 2026; the Turkish State Meteorological Service’s relay of the same date.
- Turkish State Meteorological Service: areal precipitation reports (2026 water year), monthly temperature and precipitation assessments (November 2025-March 2026), seasonal outlook (update of 5 October 2026).
- Karabörk, M. Ç., Kahya, E. (2003). The teleconnections between the extreme phases of the Southern Oscillation and precipitation patterns over Turkey. International Journal of Climatology, 23, 1607-1625.
- Karabörk, M. Ç., Kahya, E., Karaca, M. (2005). The influences of the Southern and North Atlantic Oscillations on climatic surface variables in Turkey. Hydrological Processes, 19, 1185-1211.
- Kahya, E., Karabörk, M. Ç. (2001). The analysis of El Niño and La Niña signals in streamflows of Turkey. International Journal of Climatology, 21, 1231-1250.
- Mariotti, A., Zeng, N., Lau, K.-M. (2002). Euro-Mediterranean rainfall and ENSO: a seasonally varying relationship. Geophysical Research Letters, 29.
- Price, C., Stone, L., Huppert, A., Rajagopalan, B., Alpert, P. (1998). A possible link between El Niño and precipitation in Israel. Geophysical Research Letters, 25.
- de Vries, A. J. et al. (2026). ENSO and cool-season precipitation in the Middle East (preprint in review).
- Yücel, İ., Güventürk, A., Şen, Ö. L. (2015). Climate change impacts on snowmelt runoff for mountainous transboundary basins in eastern Turkey. International Journal of Climatology, 35, 215-228.
- Peker, İ. B., Sorman, A. A. (2021). Application of SWAT using snow data and detecting climate change impacts in the mountainous eastern regions of Turkey. Water, 13.
- Ember, Türkiye Electricity Review 2026 (hydropower chapter); sector reports relaying EPDK and Ministry of Energy generation data (2025-2026); HESİAD statements.
- İSKİ, ASKİ and İZSU reservoir storage data (7-8 October 2026, as reported in the press); DSİ active storage data (22 June 2026).
- Alkazar Seasonal Climate Outlook, October 2026 update; 35-winter ENSO analysis (Alkazar, October 2026).